- Our read: long-term interest rates are staying high, and in October that is neither inflation nor the Fed. Lenders want more pay for locking money up for ten years, the term premium. Short rates fell; the 10-year followed only part of the way
- Retirement core: no action. The S&P 500's long-term trend is still up; its momentum has slowed and sits close to the line. Next check Friday 30th October
- The one number: 41% of an S&P 500 index fund sits in ten companies, and only 48% of its members trade above their 200-day average, against 74% at the August record
- The one date: Wednesday 14th October, September consumer inflation (CPI), the last big inflation print before the Fed meets on 27th-28th October
- Also inside: how to read a bond auction, what you pay per point of growth in AI chips, who pays for the AI build-out, buybacks after stock pay, and the gamma squeeze in four steps
The Weekthe long end lags
The mood this week is a record in stocks sitting on top of a nervous bond market, but the two can hardly both be right for long. Our stance: the retirement core does nothing, because our rule acts only when the long-term trend and momentum turn together at a month end, and neither has. The bond market first, because the macro matters most this week.
The usual story, a dodgy one, is that long-term yields are up on inflation fears, and one major outlet on Wednesday put the bond sell-off down to inflation and rising energy prices. Expected inflation, which the bond market prices every day as the breakeven, the gap between a normal Treasury yield and an inflation-protected one, stayed put. What did move in October was the short end, and the Fed's officials locked it in: either side of a cooler-than-expected inflation reading on 30th September, two of them said in turn that there was no urgency and that the next decision may take more time, and the two-year Treasury yield, the short end of the market, fell 0.08 percentage points to 4.80%. But the ten-year followed only part of the way, down 0.05 to 5.24%. Models can split a long yield into two parts. The first is the Fed path the market expects. The second is the extra pay lenders want for tying money up for ten years, the term premium. The New York Fed's model puts the bit that didn't follow in that extra pay: in October its expected Fed path fell and its premium rose. The Fed Board runs a second model of its own, worked out a different way, and it agrees on the direction: on its figures, which stop at 2nd October, the premium has risen since our last issue. So our read: the long end lags because lenders want more for lending long, not because they fear inflation, and not because of the Fed. On the New York Fed's model the driver has flipped since the end of August from the Fed path to the premium, which is what chart 1 shows, and on the Board's model the premium's share of the rise grew from under half to over half. But our read a fortnight ago was "more Fed, not more fear", so we claim no credit whatsoever for spotting the flip early.
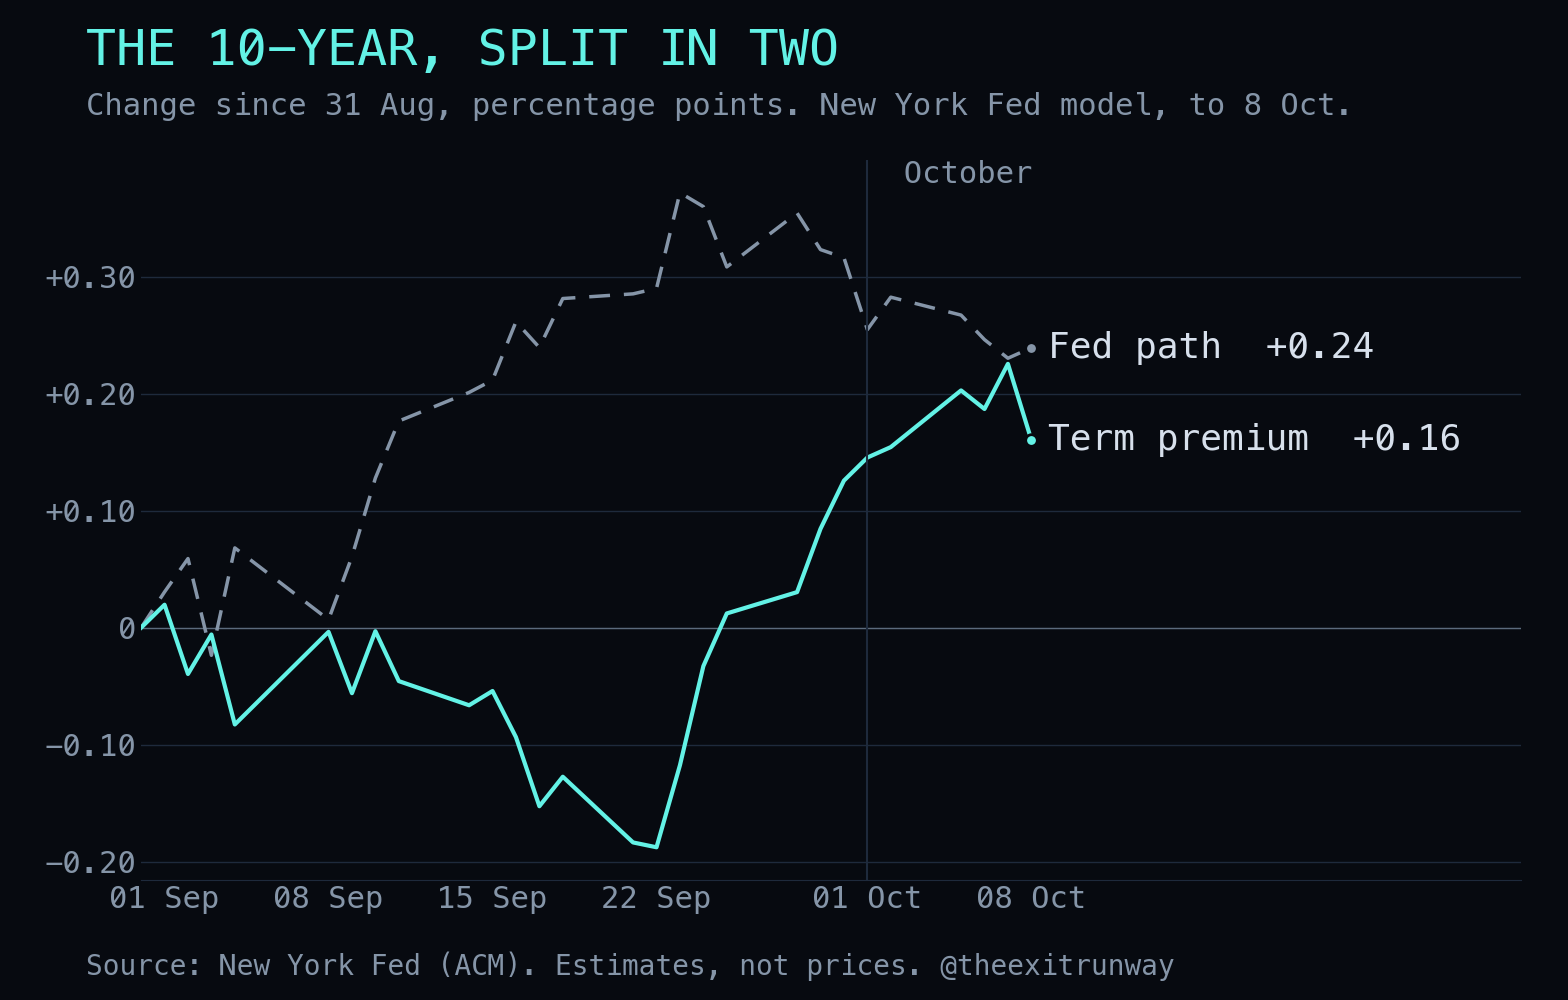
It isn't that simple, and the debt worries are real. Back in 1998, when the ten-year averaged about today's level, federal debt held by the public was 41% of the economy, and it is 98% now. The interest bill has not caught up yet, because the average rate the government pays on its existing debt is 3.48% against 5.24% in the market, but it climbs, gradually, as old debt rolls over at today's rates. The Fed's own minutes add that over the summer market commentary pointed to geopolitics, uncertainty around the Treasury's buyback programme and heavy private borrowing to fund AI infrastructure as reasons for a higher premium. More debt to absorb is one reason lenders want more pay for lending long, so the debt story and the premium story can both be true. What the breakeven argues against is the inflation story.
What does this mean? For the retirement core, nothing changes: the S&P 500's long-term trend is still up, and our rule never acts on a bond yield. For stocks, the index is at a record carried by a handful of companies priced on growth years ahead, and a higher long rate makes money due in ten years worth less today, so either long rates ease and the rest of the market catches up with the leaders, or long rates keep rising and the leaders start to struggle too; section 2 shows how narrow the index has become. For commodities, oil is the swing factor, with its own paragraph below. For anyone who borrows, a mortgage or a company's ten-year bond is priced off the long end, so the Fed sounding calmer made money only a little cheaper where it's lent for a decade, which is why a lag at the long end matters to people who never look at a bond. That is the confluence this issue traces: the long end lags, heavy new borrowers include the AI builders, and the index leans on them.
Oil, then, because in the near term it's the one thing that could turn this into an inflation story after all. Brent settled at $104.43 on Friday, back where it stood at our last issue on 25th September, but only after jumping about 4% on Thursday on a report that the White House had asked for strike options on Iran. The actual barrels, physical North Sea crude, traded about $25 above the futures price on 6th October. The margin for turning crude into diesel ran at more than three times its 2023-25 average in September, so both the crude and the refining are tight. If dear fuel starts lifting expected inflation, the five-year breakeven shows it first; it's up 0.08 since the end of July, a touch more than the ten-year, and that is the number to watch, so it heads the checks at the end.
The extra yield lenders demand for locking money up for ten years instead of lending for a few months at a time and rolling it over. It can't be observed, only estimated, which is why we quote two models. When it rises, long-term borrowing costs rise even if nobody expects the Fed to do anything.
The week's data points, each with a verdict. The ten-year closed at 5.31% on 5th October, its highest since 2002, and it has eased since. The jobs report was grim, 29,000 added in September, which backed up the Fed's calmer tone: traders now put this month's hike odds at about one in five, but they still price about an 85% chance of a hike by December; this meeting may pass without a hike, but on those odds the year will not. Bond markets are nervous and stock markets are calm: the swing that options price into Treasury yields, bond vol in desk terms, peaked on 5th October close to its high for the year, but the same measure for the S&P 500 is low by its own history and the index set a record close on Tuesday, so which one is paying attention? Credit had a nasty wobble, the extra yield on riskier company bonds over Treasuries rising to 3.24% at the start of the month and settling at 3.15%, but stocks didn't notice.
The auctions next, because the "buyers' strike" story, the idea that lenders were refusing to lend to the US government, was born at one of them and died at the next. Three numbers read an auction: bid-to-cover, the dollars bid for each dollar on offer; the share taken by the big outside buyers, meaning foreign central banks and large funds; and the share left to the dealers, the banks obliged to bid at every auction. More bids, more to outsiders and less left to dealers means strong demand, whatever the yield.
| 5-year, 23rd Sep | 10-year, 7th Oct | 30-year, 8th Oct | |
|---|---|---|---|
| Bid-to-cover (dollars bid per dollar sold) | 2.21 (average 2.33) | 2.77 (average 2.54) | 2.54 (average 2.41) |
| Outside buyers (foreign central banks, big funds) | 54% (average 65%) | 80% (average 74%) | 72% (average 69%) |
| Dealers (the banks obliged to bid) | 15.8% (average 12.9%) | 2.5% (average 8.8%) | 6.8% (average 10.3%) |
| Verdict | weak | strong: the lowest dealer share since 2008 | strong |
Averages are the prior six auctions of that maturity. The 5-year priced 0.031 above the market just before it, a "tail"; the 10-year priced 0.017 below it, a "stop-through", as reported by one news site.
The strike story fits the five-year well enough, but set beside the ten-year, which had the lowest dealer share in eighteen years, it looks daft. At 5.30% the buyers bid 2.77 times what was on offer and took it a little below the market yield, and the thirty-year on Thursday read the same way. Nobody refused to lend, but the price of lending went up first, and then the lenders queued, which is how a market clears. The verdict: the auctions went well, and they change nothing in the thesis.
The week ahead, in US Eastern time, and Wednesday is the day that matters.
| Day | What | Why it matters |
|---|---|---|
| Mon 12th Oct | Columbus Day: US bond market closed, stocks open | No Treasury prices that day |
| Tue 13th Oct | JPMorgan and Wells Fargo results (before the open) | First read on loans, credit and the consumer |
| Wed 14th Oct | September CPI (8:30). ASML results. Fed Beige Book (its survey of regional business conditions) | CPI is the last consumer-inflation print before the 27th-28th Oct Fed meeting |
| Thu 15th Oct | PPI (prices businesses receive) and retail sales (8:30). TSMC results (2am ET) | TSMC is the main factory behind leading-edge AI chips (section 3) |
| Fri 16th Oct | Industrial production |
Further ahead.
| Day | What | Why it matters |
|---|---|---|
| Tue 27th-Wed 28th Oct | Fed meeting | Hike odds for this one fell to about one in five |
| Fri 30th Oct | The October close | The retirement check |
Your Moneya record, and most of the index wasn't invited
The index is at a record but most of the stocks in it are not, so an index-fund holder owns rather more of ten companies than the word "index" suggests. That is a reason to know what you own, but no reason to stop spreading risk. The retirement core does nothing this week, which is the rule behaving.
The S&P 500's long-term trend is still up; its momentum has slowed, but slowed is not turned. What would change it: both have to turn, on a month-end close. Momentum is the near one: an October close below about 7,633, about 2% under Friday's close, turns it to caution, and on its own that is a watch, nothing more. The long-term trend is far away: it turns only if the S&P 500 falls to about 6,300, roughly 19% below Friday's close, and again only on a month-end close, never on a bad Tuesday. Next check: Friday 30th October, the October close.
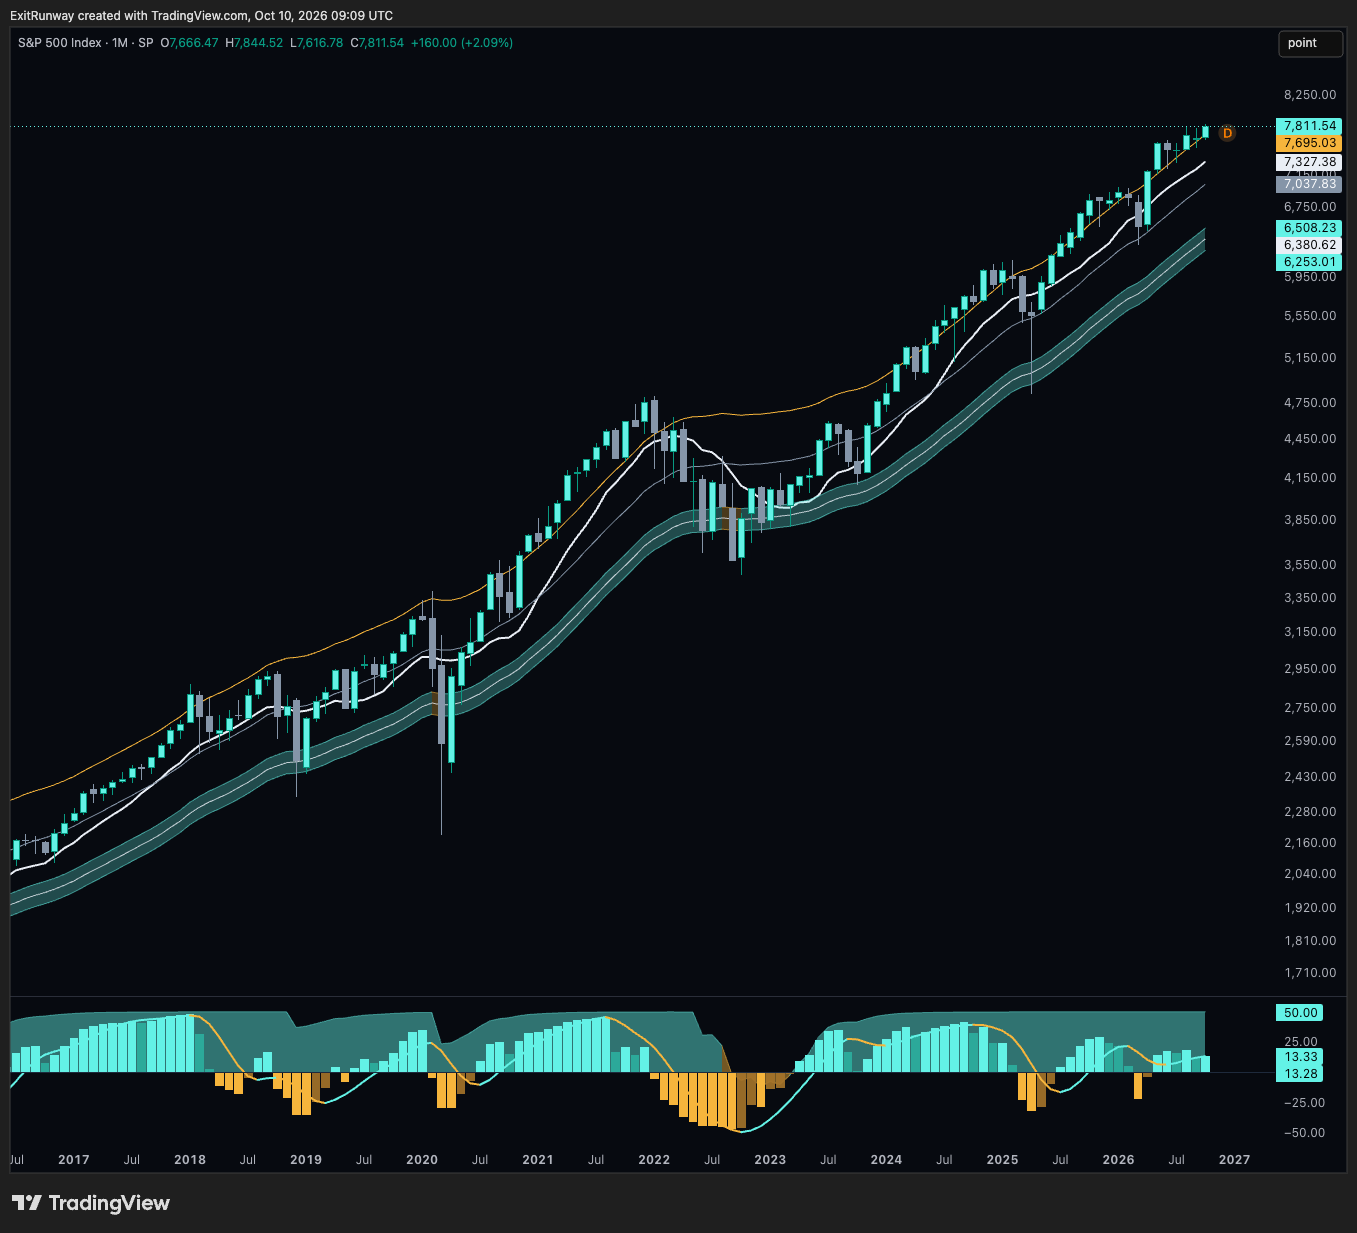
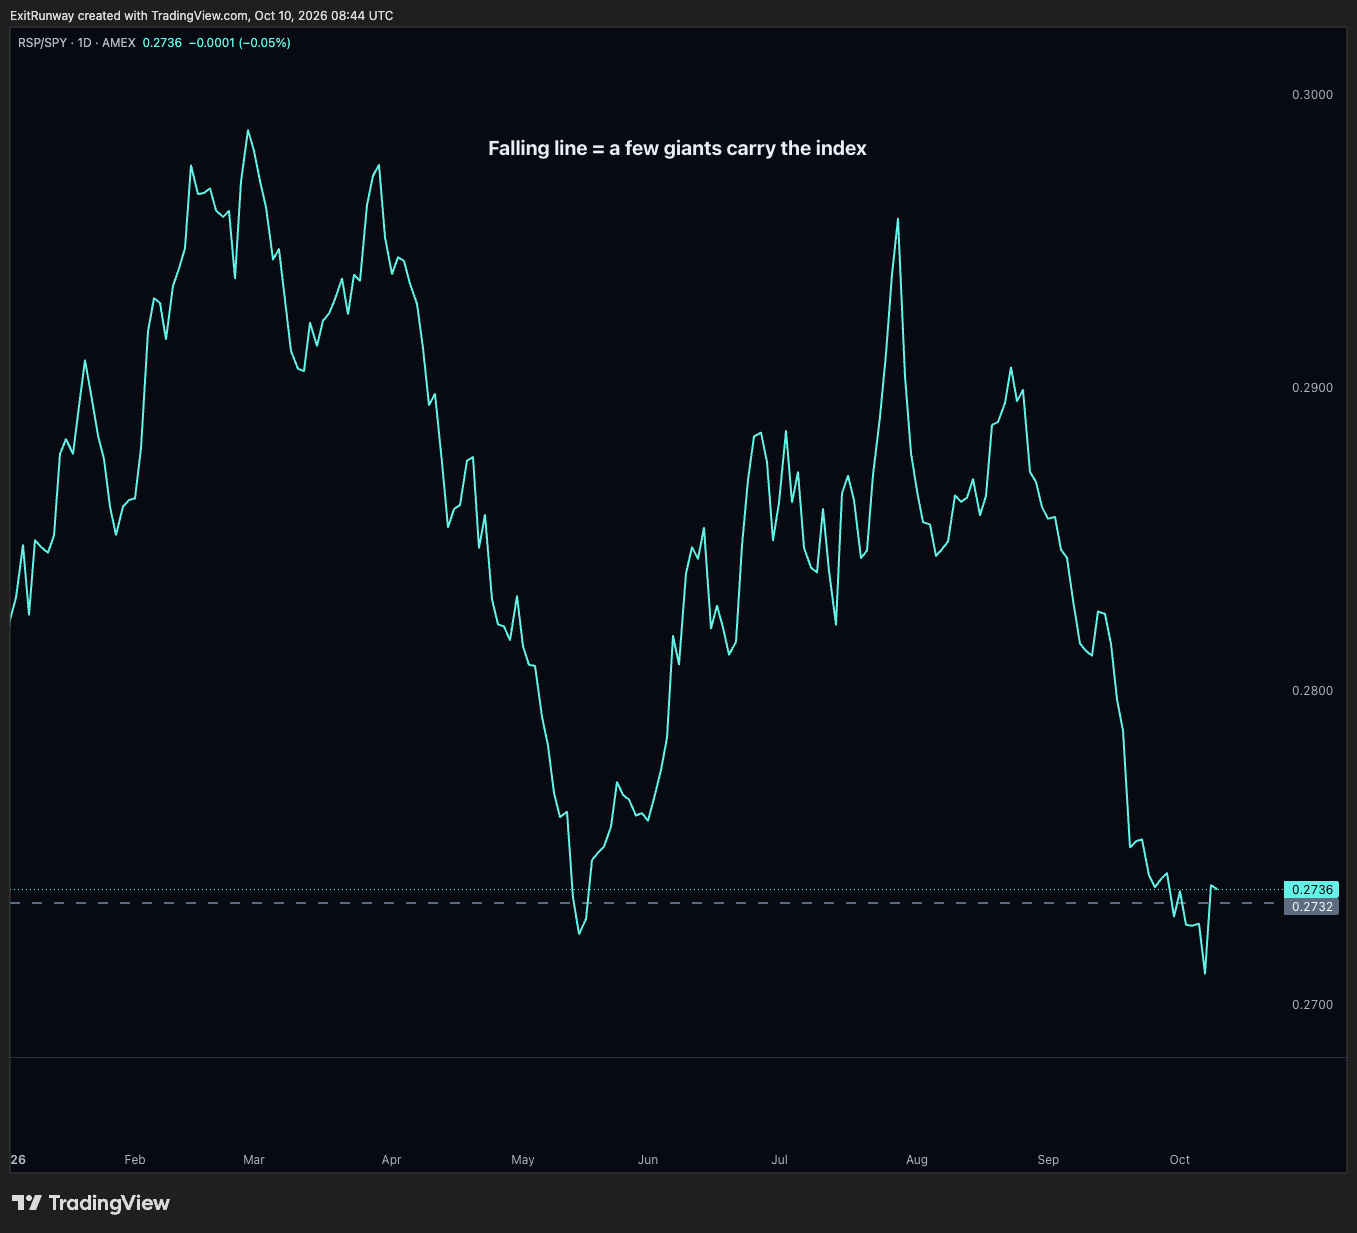
The concentration first. 41% of an S&P 500 fund now sits in ten companies, and the ten include the familiar giants plus Micron (MU) and AMD (AMD). Breadth, the count of stocks actually joining the move, is thin under the record: only 48% of the index's members trade above their 200-day average, the average close of the last two hundred sessions, against 74% at the August record. The equal-weight version of the index (RSP), where every company counts the same, is up 11.2% this year against 14.2% for the normal, size-weighted fund (SPY), but Thursday showed the mirror image in miniature. With the chip stocks down, the equal-weight fund rose and SPY fell, a gap of about one point in a single session. One day makes no trend, but it is what chart 2's line measures, and the link to section 1: the giants carrying the index are priced on growth years ahead, the kind of price a high long rate presses on hardest.
Momentum is the less flattering half. Our reading of it has lost about a third of its strength since the August close and now sits close to the line: an October close below about 7,633 would turn it to caution, but the index closed Friday only about 2% above that level, closer than a record ought to feel. Caution on its own goes on the watch list. We act only when the trend turns too, and only on a month-end close; the trend is about 19% away.
This Weekly covers two books: the retirement core above, and a separate, smaller pot of trading money. This week's lesson for the trading money comes from Thursday, when Micron fell 4.8% in a day on someone else's news, the OpenAI report in section 3. The lesson: position size is set by how far the stock can fall in a day, and never by how much you like it. A stock that can drop 15% in a day, held at 4% of the trading book, costs 0.6% of the book on that day. That 0.6% is the risk per trade, and the size decided it; at 8% of the book the same stock costs 1.2%, and the stock did nothing different. Simple, and hardly ever kept, which is how trading money gets clobbered. Section 3 shows why a chip stock can fall on news about its customer rather than itself.
The AI Tradethe chain is only as strong as the customer
Every link in the AI chip chain, the power, the memory, the networking and the one company whose factories make most of the leading-edge chips, sends its bill to the same handful of customers, and this week the market remembered, abruptly, that the customer has to be able to pay. Price matters too: per point of growth, some names cost many times what others do, as the table below shows.
The factory first. Most leading-edge AI chips, whoever designs them, are made by TSMC (TSM); Broadcom (AVGO) says about 95% of its contract-made wafers, the silicon discs chips are cut from, come from there, and AMD relies on TSMC for all its advanced processor wafers. On Thursday 8th October TSMC reported September sales up 54.6% on a year earlier, in Taiwan dollars, but the chip stocks fell anyway: the Philadelphia semiconductor index dropped 3.4% and Micron 4.8%. The trigger, as Reuters relayed it, was a Financial Times report that OpenAI had told investors its annualised revenue was about $50bn, against the roughly $70bn reported in late September. Annualised revenue is a run-rate, one month's sales times twelve, a different measure from a year's reported revenue, so check what each number measured before comparing them, a step a kneejerk selloff always skips. The lesson stands whichever figure is right: the factory's own good news didn't lift it once one of the biggest buyers at the end of the chain looked smaller, because every link rests on the same handful of buyers. Behind the factory sits one more link, ASML (ASML), which its own annual report calls the world's only maker of the machines needed for the most advanced chips, and it reports on Wednesday.
Now the price per point of growth. Take the forward multiple, the share price divided by the next twelve months' expected profit, and divide it by the revenue growth expected next fiscal year, in percentage points. Lower means less paid for each point of growth. One source, one date, Friday's close.
| Company | Forward P/E | Revenue growth expected, next fiscal year | Paid per point of growth |
|---|---|---|---|
| Nvidia (NVDA) | 19.0x | +68.2% | 0.28 |
| Broadcom (AVGO) | 20.9x | +64.1% | 0.33 |
| TSMC (TSM) | 20.3x | +35.3% | 0.58 |
| AMD (AMD) | 54.8x | +74.6% | 0.73 |
| ASML (ASML) | 32.5x | +27.3% | 1.19 |
| Arm (ARM) | 111.6x | +36.2% | 3.08 |
| Intel (INTC) | 62.0x | +14.8% | 4.19 |
Micron (MU) and Qualcomm (QCOM) are left out: the measure breaks on a cyclical and on near-zero growth. TSMC on the US-listed share was about 0.67 on 7th October; the order holds.
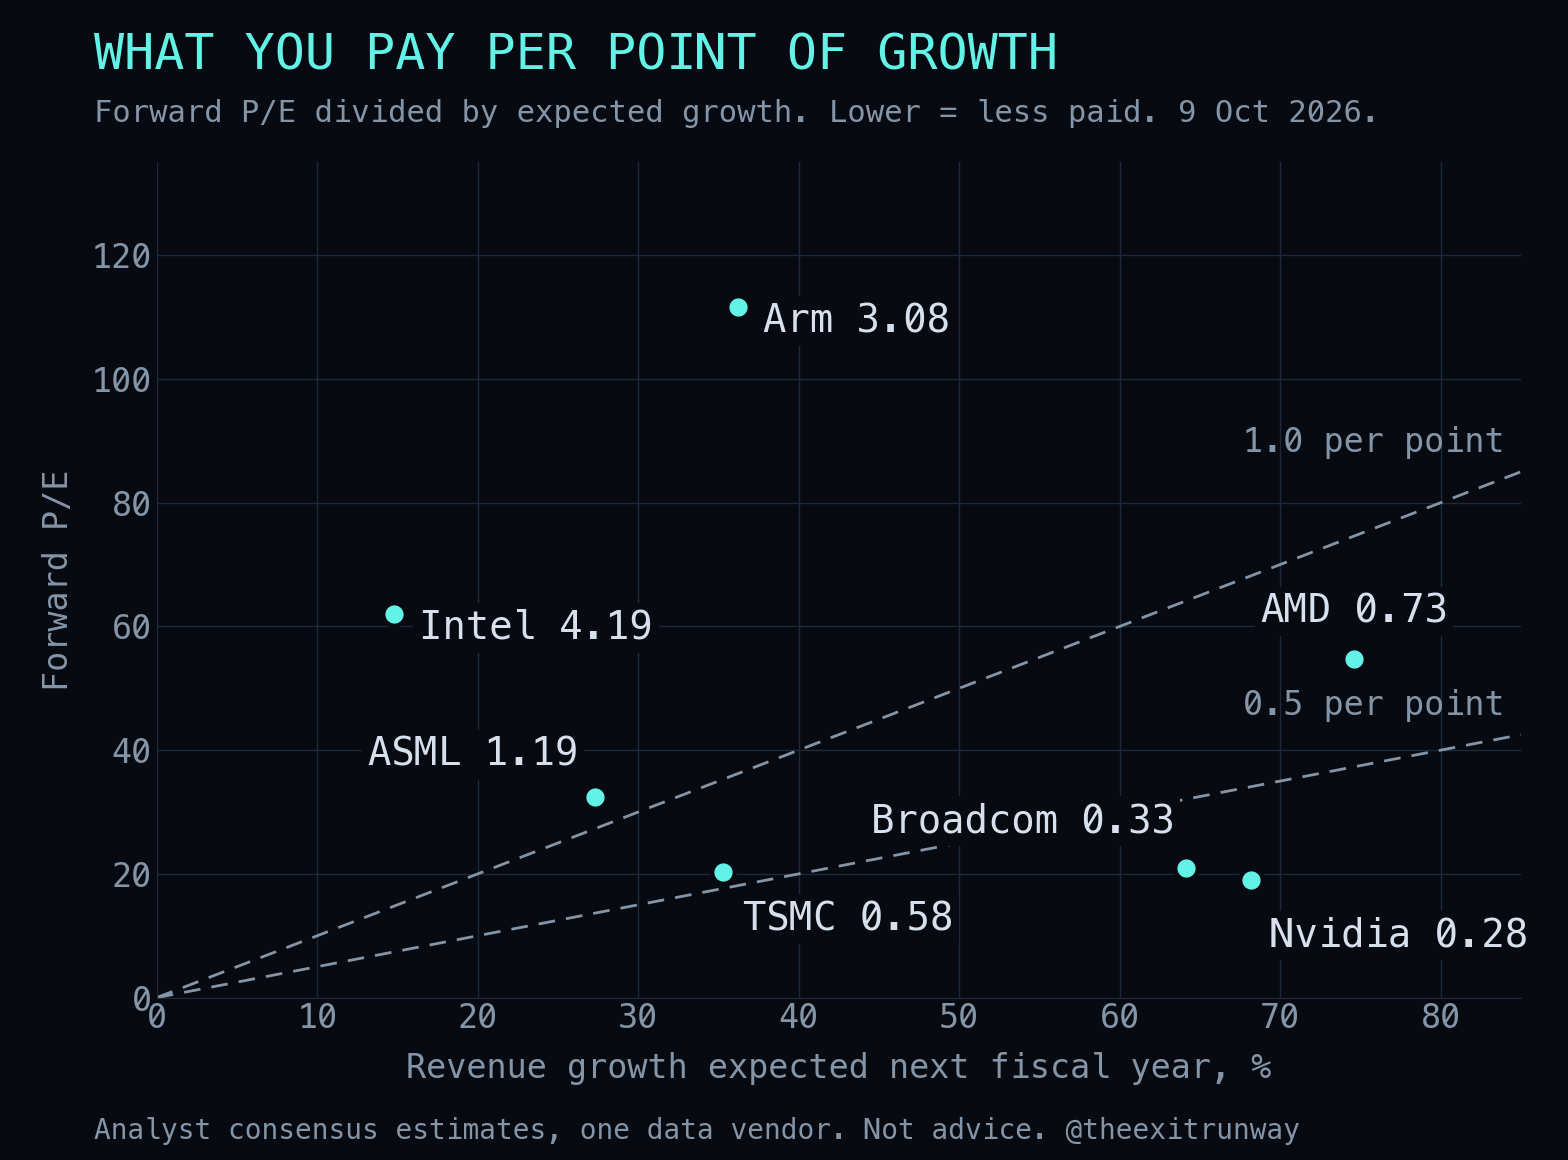
The reading, and numbers only: Nvidia and Broadcom have the lowest ratio, and Arm and Intel sit several times higher on every measure we tried. The table has blind spots: it ignores margins, it uses one year of growth, and it says nothing about how long that growth lasts. A crude tool, but one applied the same way to seven companies beats a precise one applied to none. A great company and a low ratio are different things, and this table measures only the ratio. One correction: last issue we said the gap between two vendors' AMD multiples said more about forecasting than about AMD, and it was mostly two different fiscal periods being quoted, a mistake that was ours alone.
Who pays for all of it? Bain & Company's Technology Report 2026 does the sum in one division: yearly spending on AI infrastructure could reach about $1.5 trillion by 2031, and if an industry can keep spending about a quarter of its revenue on building, a ratio Bain itself calls ambitious but reasonable, then the industry needs about $6 trillion of AI revenue a year to carry it. Today's AI products, on Bain's count, get to somewhere between $1.2 and 1.8 trillion by then, but the rest is jam tomorrow, good things promised for later, by the trillion. The revenue half is a forecast, but the spending half is already on the record: in their latest quarters Microsoft, Alphabet, Amazon, Meta and Oracle put 39.5% of their combined revenue into property and equipment, Meta about half its revenue, and Oracle more than its revenue. Which brings the chain back to section 1, because that building is funded by more than cash flow. Meta (META) raised $24.9bn of bonds this year, the kind of heavy private borrowing the market commentary in the Fed's minutes named as one reason lenders want more for lending long. Alphabet (GOOG) sold $30.5bn of new shares, which isn't borrowing, though it competes for the same investors' money. The AI build-out is one strand of the term-premium story, told from the other end.
The Mag 7who is really buying itself back
The buyback headlines are enormous, but the real number is small. After subtracting the shares handed to staff as pay, the seven tech giants in the table below, the Mag 7 as they're known, returned about 0.3% of their value over the last twelve months, and most of them are issuing about as many shares as they retire. For an index-fund holder with two-fifths of their money in ten names, that is worth knowing, and it ties to section 2: on the whole, the giants are not shrinking their share count.
| Stock | vs 200-day | Buybacks minus stock pay, last 12 months, % of value | Share count vs a year ago |
|---|---|---|---|
| Apple (AAPL) | +15.8% | +1.39% | -1.56% |
| Nvidia (NVDA) | +13.4% | +0.84% | -1.01% |
| Microsoft (MSFT) | +23.3% | +0.25% | about -0.2% |
| Meta (META) | +14.1% | -1.19% (-0.20% counting shares held back for tax) | -0.16% |
| Tesla (TSLA) | -2.0% | -0.25% | +0.60%† |
| Alphabet (GOOG) | +2.8% | -0.25% (-0.96% with the June share sale) | +0.91% |
| Amazon (AMZN) | +8.4% | -0.69% | +0.90% |
† Tesla: the diluted count leaves out the chief executive's restricted award until it's earned; shares issued rose from 3,751m to 3,949m in the first half of 2026. Prices are Friday's close; the two right-hand columns come from the filings.
The headline in proportion. On 28th September Nvidia (NVDA) added $150bn to its buyback, the largest authorisation on record, and as a share of the company it's 2.8% of what Nvidia was worth the Friday before. An authorisation is a ceiling, but hardly a promise: Nvidia actually spent $55bn in the last twelve months, which after stock pay comes to 0.84% of its value. Always divide. Does the headline ever? Rarely, and that is the silly part.
The rest of the field. Apple (AAPL) is shrinking its share count fastest, down 1.6% in a year, with Nvidia the only other one to reach 1%, but is two out of seven a field at all? Alphabet (GOOG) bought nothing this year but sold $30.5bn of new shares instead, to fund AI infrastructure, so its growth is still growth, but shared out more thinly. Meta (META) bought nothing either, but its share count is roughly flat, because when staff awards vest it holds back shares to cover the tax and pays the cash itself, $18.1bn of it in a year. That works like a buyback: those held-back shares never reach the market, so the share count stays flat, but no headline announces it. Microsoft (MSFT), Meta and Amazon (AMZN) report in the coming weeks, and the number to read is the capex guide, what each says it will spend on data centres and chips, since that is the money section 3's chain is waiting on.
Softwarehow to tell what moved a stock
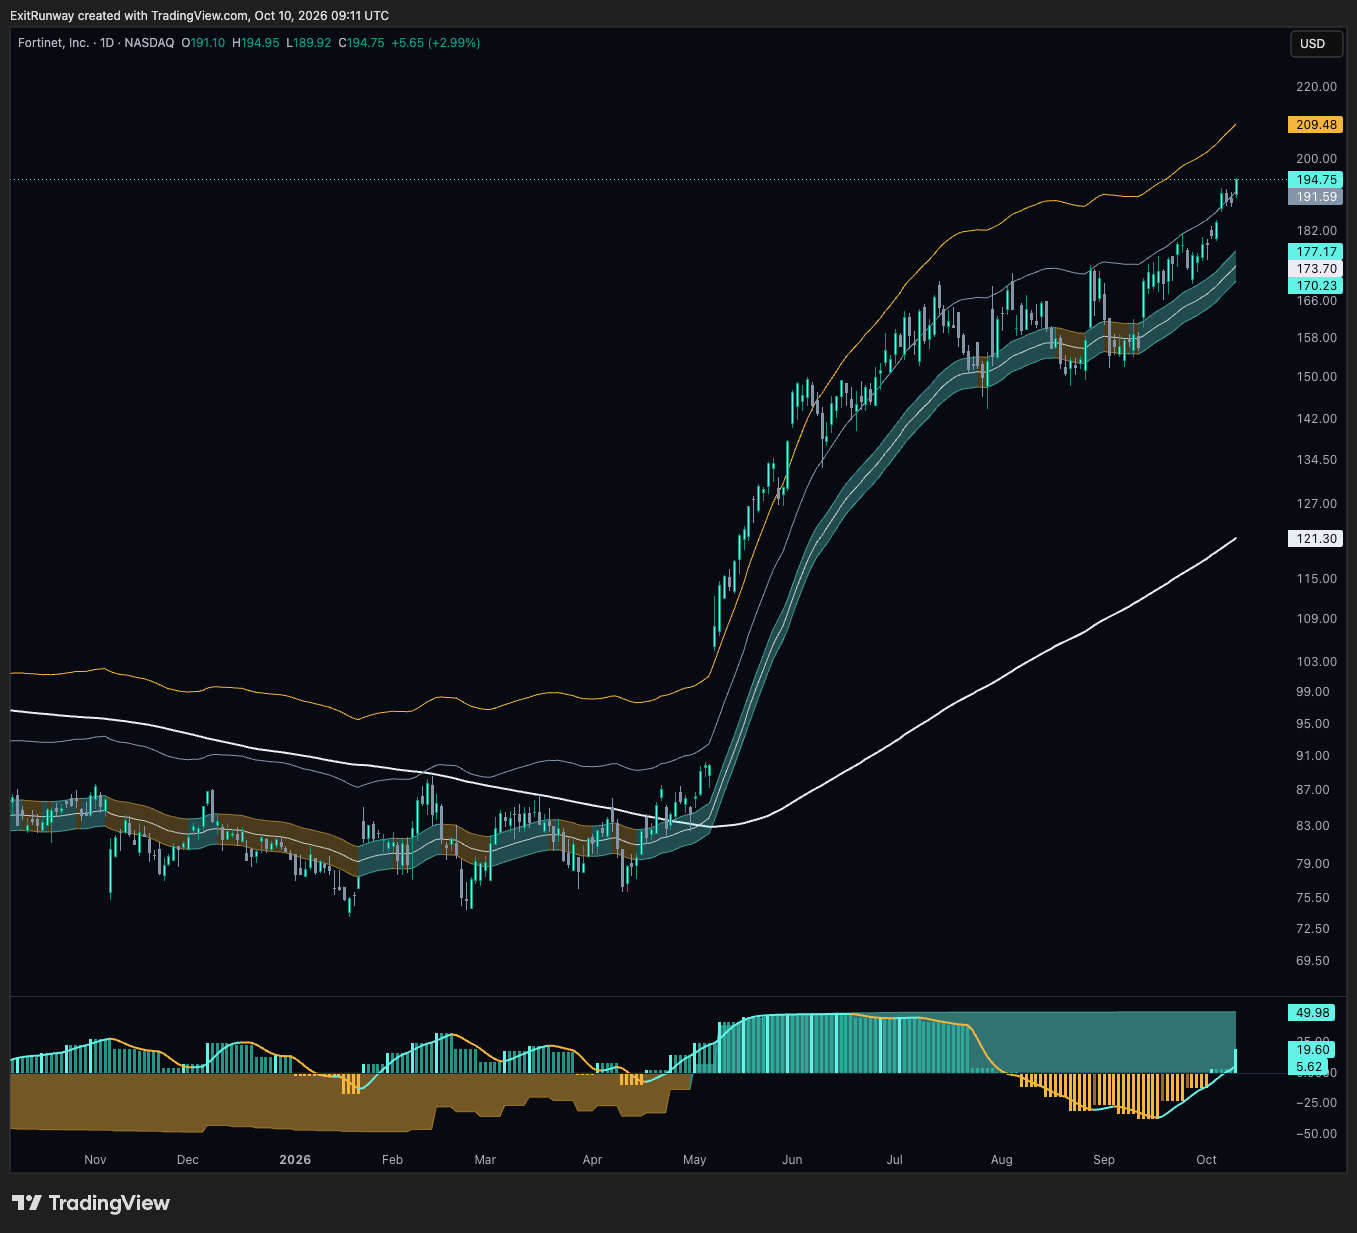
The cyber-security rally looks like investors paying more for the same profits, but on the dates we looked at, the fashionable explanation, a gamma squeeze, doesn't show up in two numbers anyone can check. It connects to section 1 because a price rising on an unchanged profit is a bet on the multiple, and a high long rate is precisely what presses on that bet. The rally itself: since 10th September CrowdStrike (CRWD) is up 32%, Zscaler (ZS) 43% and Fortinet (FTNT) 23%, against 11% for the software ETF (IGV, a fund holding US software companies). We expected a squeeze ourselves, but the data had other ideas.
The gamma squeeze first, in four steps, with a made-up stock:
- Traders buy ten thousand call options (the right to buy at a set price) on stock XYZ. Each covers a hundred shares, so a million shares in all
- The dealer who sold them hedges, taking a position that gains when the main bet loses, by owning shares in proportion to the chance the options pay off. At roughly a 30% chance, that is 300,000 shares
- XYZ rises. The chance rises to roughly 60%, so the dealer must own 600,000 and buys the difference, into a rising price. That speeding-up of the hedge is the gamma
- That buying lifts the price again, and the loop repeats until the options expire or the price turns. Then it runs in reverse, and the dealer becomes a forced seller, which the call buyers in step 1 rarely plan for, and are hammered by
A short squeeze is the cousin: short sellers, who borrowed shares and sold them betting on a fall, buying back in a hurry. Its fuel is short interest, the share of a company's stock that has been sold short, which is why the check below looks at both.
The check, two numbers anyone can look up. First, options: on Wednesday 7th October all three stocks traded more puts, the right to sell, than calls, which shows no rush into calls, but on Friday only Fortinet crossed 1.5 calls per put, for one session, which makes it a watch and no more. Second, short interest: low in CrowdStrike and Fortinet in mid-September, and higher in Zscaler at roughly 6% of its tradable shares, though about a day and a half of normal trading would cover it. CrowdStrike's short position actually grew into the rally, which is the opposite of a squeeze. The positive evidence for the plainer story: CrowdStrike's expected profit for the next twelve months was $1.41 a share on both 25th September and 9th October, the average forecast didn't move, but the shares rose 9.1% in that window regardless. Same profit, higher price: that is multiple expansion, a re-rating, duller than a squeeze and far more common, but the squeeze stories are what get the threads, nonsense or not.
The price tag, and it's arithmetic, not a verdict. Fortinet trades at 55 times next year's adjusted profit. For that to fall to 30 times in five years at today's price, profit has to grow 13.1% a year, but the street, the bank analysts averaged, expects about 9.5% next year. Numbers only, and the verdict isn't ours to give.
What Would Change Our Mind
Every issue we name, in advance, what would prove our read wrong, each with a number and a date, and the next issue scores them, because a check never scored is decoration; that is how you can hold us to account. Last issue's seven:
| Last issue's check | Result |
|---|---|
| Hormuz reopens | Not yet |
| 10-year breakeven above 2.5% | No, 2.33% |
| Investment-grade spread above 1.0% | No, 0.82% |
| 10-year back below 5% for a month | No, 5.24% |
| RSP/SPY turns up | No, flat: RSP trailed SPY by 0.02 points since 25th Sep |
| Micron guides gross margin above 86% and the stock holds | Yes on the adjusted basis (86.25%), just under on standard accounting (85.95%); the stock rose 3% the next day |
| Payrolls well above consensus | The opposite: 29,000 against about 90,000; it backed the Fed's calmer tone and moved our read |
Five no's, one yes on the kinder accounting, but one went the opposite way and moved our read. This issue's checks, each with a size and a window:
The 5-year breakeven rises 0.10 from 2.34% by our next issue. Then expected inflation is doing the lifting and the lead is wrong. Oil is the route, so it heads the list.
The New York Fed's term premium falls back below 0.77%, its level at our last issue. Then the long end calmed, the gap closed, and this issue's title looks a touch premature.
The core CPI print on Wednesday beats consensus by 0.1 point or more, month on month. Then hike odds jump back and the short end leads again, which would make October look rather like September.
RSP beats SPY by 2 points over a month, having trailed by 3.8 over the last one. Then breadth is improving and the rest of the index gets its invitation.
TSMC guides fourth-quarter revenue below about $48bn at the midpoint on Thursday, our arithmetic from September's sales. Then the factory end is slowing, and every growth figure in section 3's table and chart rests on the factory.
Dates to hold us to: CPI on Wednesday 14th October, TSMC on Thursday 15th October, the Fed meeting on 27th-28th October, and the October close on Friday 30th October, which is the retirement check.
The short end has moved, but the long end has come only part of the way with it, so far. Wednesday's inflation number is the first chance to find out which of them is right, and the Fed, for once, isn't the one deciding.
- Breakevens: the inflation the bond market expects, read as the gap between a normal Treasury yield and an inflation-protected one
- The short end and the long end: short-term and long-term interest rates; the curve is all of them lined up by maturity, and it steepens when the gap between the two ends grows (curve steepening)
- Bid-to-cover: at a bond auction, the dollars bid for each dollar on offer; higher means stronger demand
- Breadth: how many stocks are joining a move, whatever the index itself is doing
- Run-rate: one month's sales multiplied by twelve, a different thing from a year's reported revenue
- Buyback after stock pay: what a company spends buying its own shares, minus the shares it hands to staff as pay
- Re-rating: a price moving because investors pay a different multiple of the same profit; up is multiple expansion, down is compression
- Gamma squeeze: a rally fed by option dealers buying shares to hedge the calls they sold, strongest when the shares trade near the options' strike price
- Short interest: the share of a company's stock that has been borrowed and sold by people betting on a fall
- Capex guide: what a company says it will spend on buildings, servers and chips in the coming period
The free community
Leave your email and your Discord invite is in the confirmation email we send you straight away. The Weekly follows every Sunday.
Send my invite »