- Our read: long-term rates fell again on Thursday, and again the reason was fear. The new part is inflation. The inflation the bond market expects over the next five years rose in the same week because oil kept climbing. Fear and inflation together is the one mix we said has no good answer, and this week showed the start of it, at the five-year horizon only. The ten-year and longer have not priced it
- Retirement core: no action. The S&P 500 sits about 2.5% under its record close and the portfolio stays on the same allocation
- The one number: 2.48%. That is the inflation the bond market now prices in over five years, up 0.11 on the week to its highest since June. Brent crude rose about 6% in the same week
- The one date: Wednesday 28th October. The Fed decides at 2:00 pm Eastern and Microsoft (MSFT) reports after the close the same evening. Prediction markets put a hike at about 6% as of Saturday
- Also inside: a rotation again, two thirds of the index's stocks up in a down week; who pays for AI, after Meta (META) moved the bottom of its spending range up and was sold; good news and a falling stock; and last issue's checks, scored: one yes, four no
Fear and inflation at the same time
It has been a long time since one Thursday said so much about where this market is. For three days the week was a breather after last week's slide. Bond yields drifted, stocks edged higher and oil marked time. Then Thursday 22nd October arrived and made more noise than any day in months. The ten-year Treasury yield had its biggest one-day fall in over two years, the chip stocks had their worst day since June and oil jumped on the very same day. Quite a day. Friday gave some of it back, bonds about a quarter of the move, the defensive stocks most of their jump, chips barely any. Our stance has not moved an inch. The retirement core does nothing and stays on the same allocation.
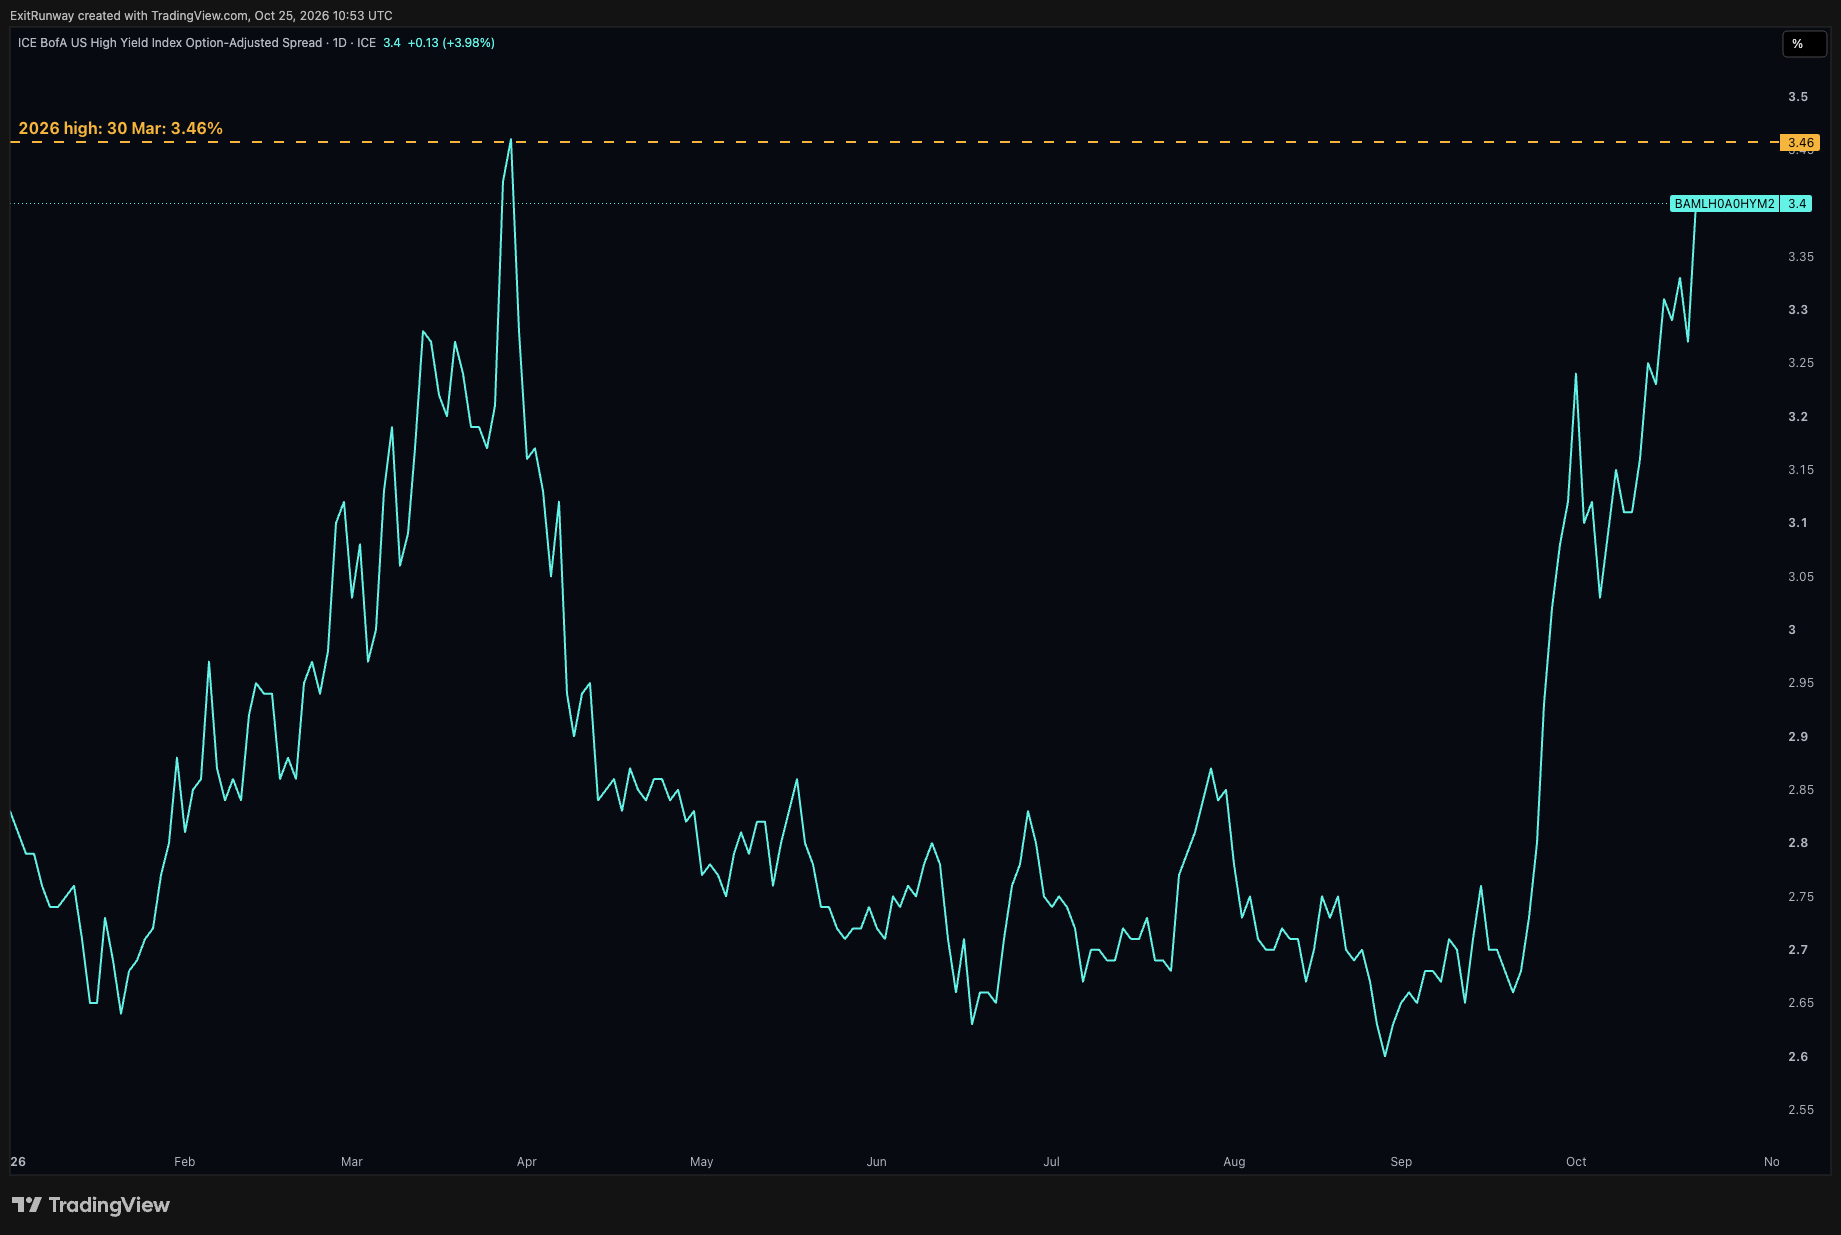
First the scorecard. Last Sunday we put two things on the table and said what each would mean. We said rates were falling because of fear, not because inflation was cooling. We said oil was the second thing to watch, after the junk spread, because a climbing oil price would add inflation to that fear, and fear plus inflation is the bad case for bonds. And we said the junk spread, the extra yield junk-rated companies pay over the government, had to close above 3.46%, its high for the year, before we would call the fear spreading. So what happened? Oil did exactly what we were worried about, at the five-year horizon only. The test we set was the five-year breakeven rising 0.10 from 2.37% with Brent above $105. The breakeven is the inflation the bond market expects over those five years. It rose 0.11 to 2.48%, just over the line, and Brent stayed above $105 all week, so that check fired. The junk spread check did not. Thursday's reading, the one the check named, was 3.40%, under the line. Our order was half right, which is a polite way of saying half wrong. The second check fired and the first did not. The spread is what jumped on the day. Oil is what moved the inflation signal across the week. The macro is in charge again, and this week the macro is bonds and oil.
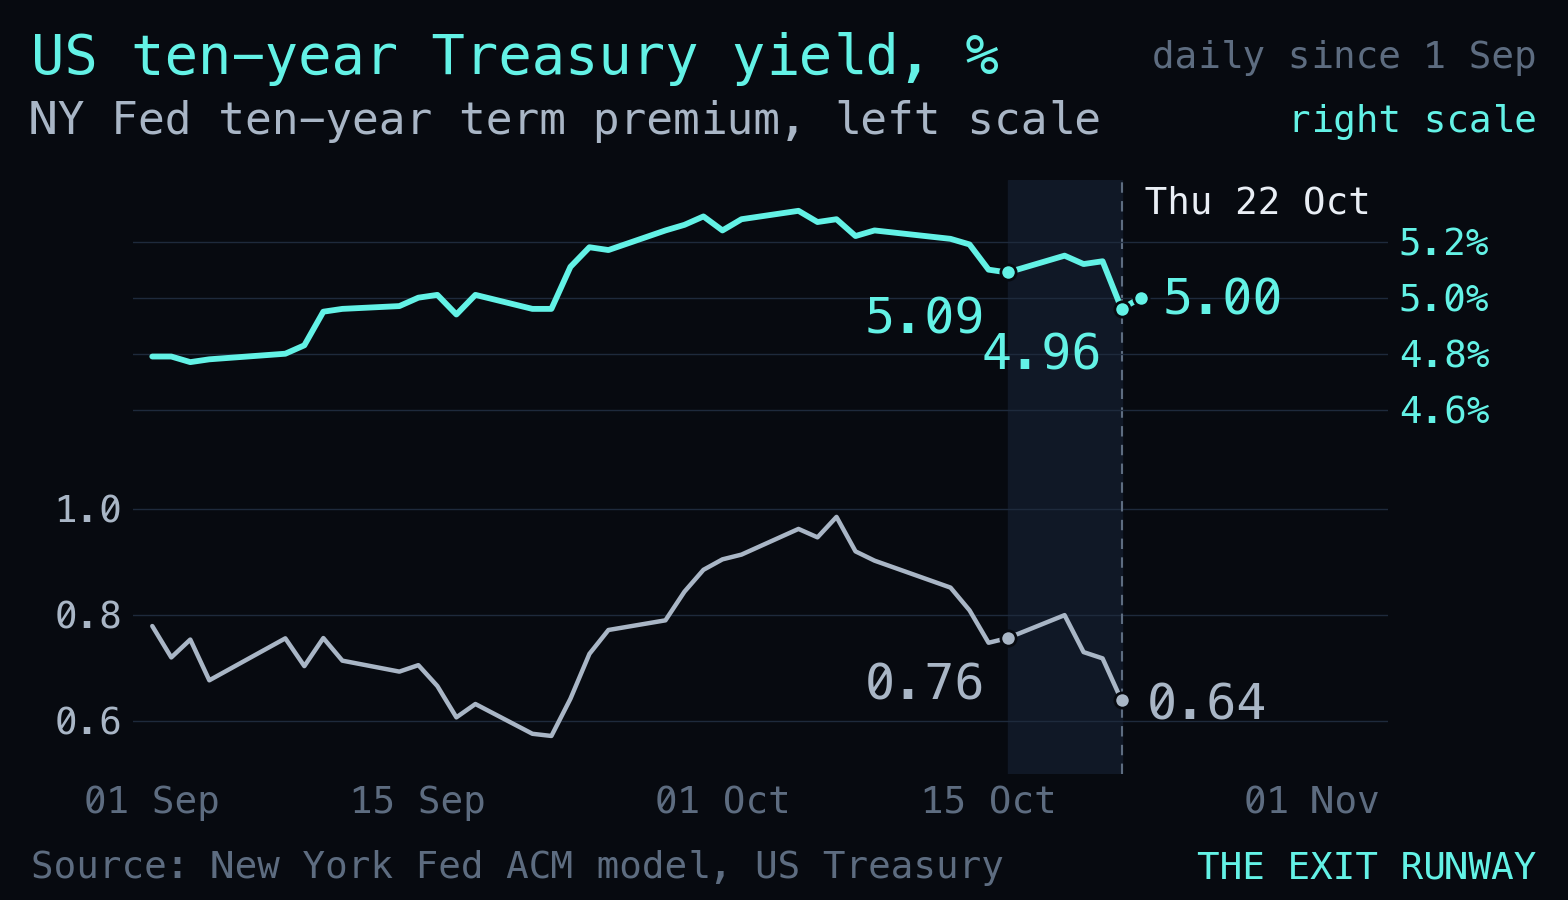
The usual story about Thursday is short and comfortable. An AI spending scare, shares down, yields down, money out of anything risky and into anything safe. Look under the hood and it is less comfortable than that. The ten-year yield fell about a tenth of a point on the week to 5.00%, and all of it and more was Thursday, 5.13% to 4.96%, a fall of 0.17 and the biggest one-day drop since August 2024. The four other days together rose. The New York Fed runs a model that splits a yield into the Fed path the market expects and the term premium, the extra pay for lending long. On that model about four-fifths of the fall to Thursday sat in the term premium and the expected Fed path barely moved. That is fear, same as last week. Nothing new in that. Lenders wanted the safety more than the pay. One caveat: it is a model, not a thermometer, and its last reading is Thursday.
Now the bit that is new. The five-year breakeven rose 0.11 on the week to 2.48%, its highest since June, while the five-year real yield, the yield after expected inflation, fell 0.18. So the market paid up for safety and for inflation protection in the same week. That is precisely the mix we said we did not want to see. Be clear about the size of it though. This is a five-year story so far. The ten-year breakeven did not rise, 2.35% to 2.34%, and the twenty and thirty-year readings slipped a touch too. On Thursday itself the five-year breakeven rose 0.05 while the ten-year fell 0.05. The honest version is a fear rally in long bonds with oil pushing up the inflation the market expects over the next few years. It is not the bond market pricing an inflation scare. Not yet. The worry has not reached the long end. The ten-year breakeven is the test.
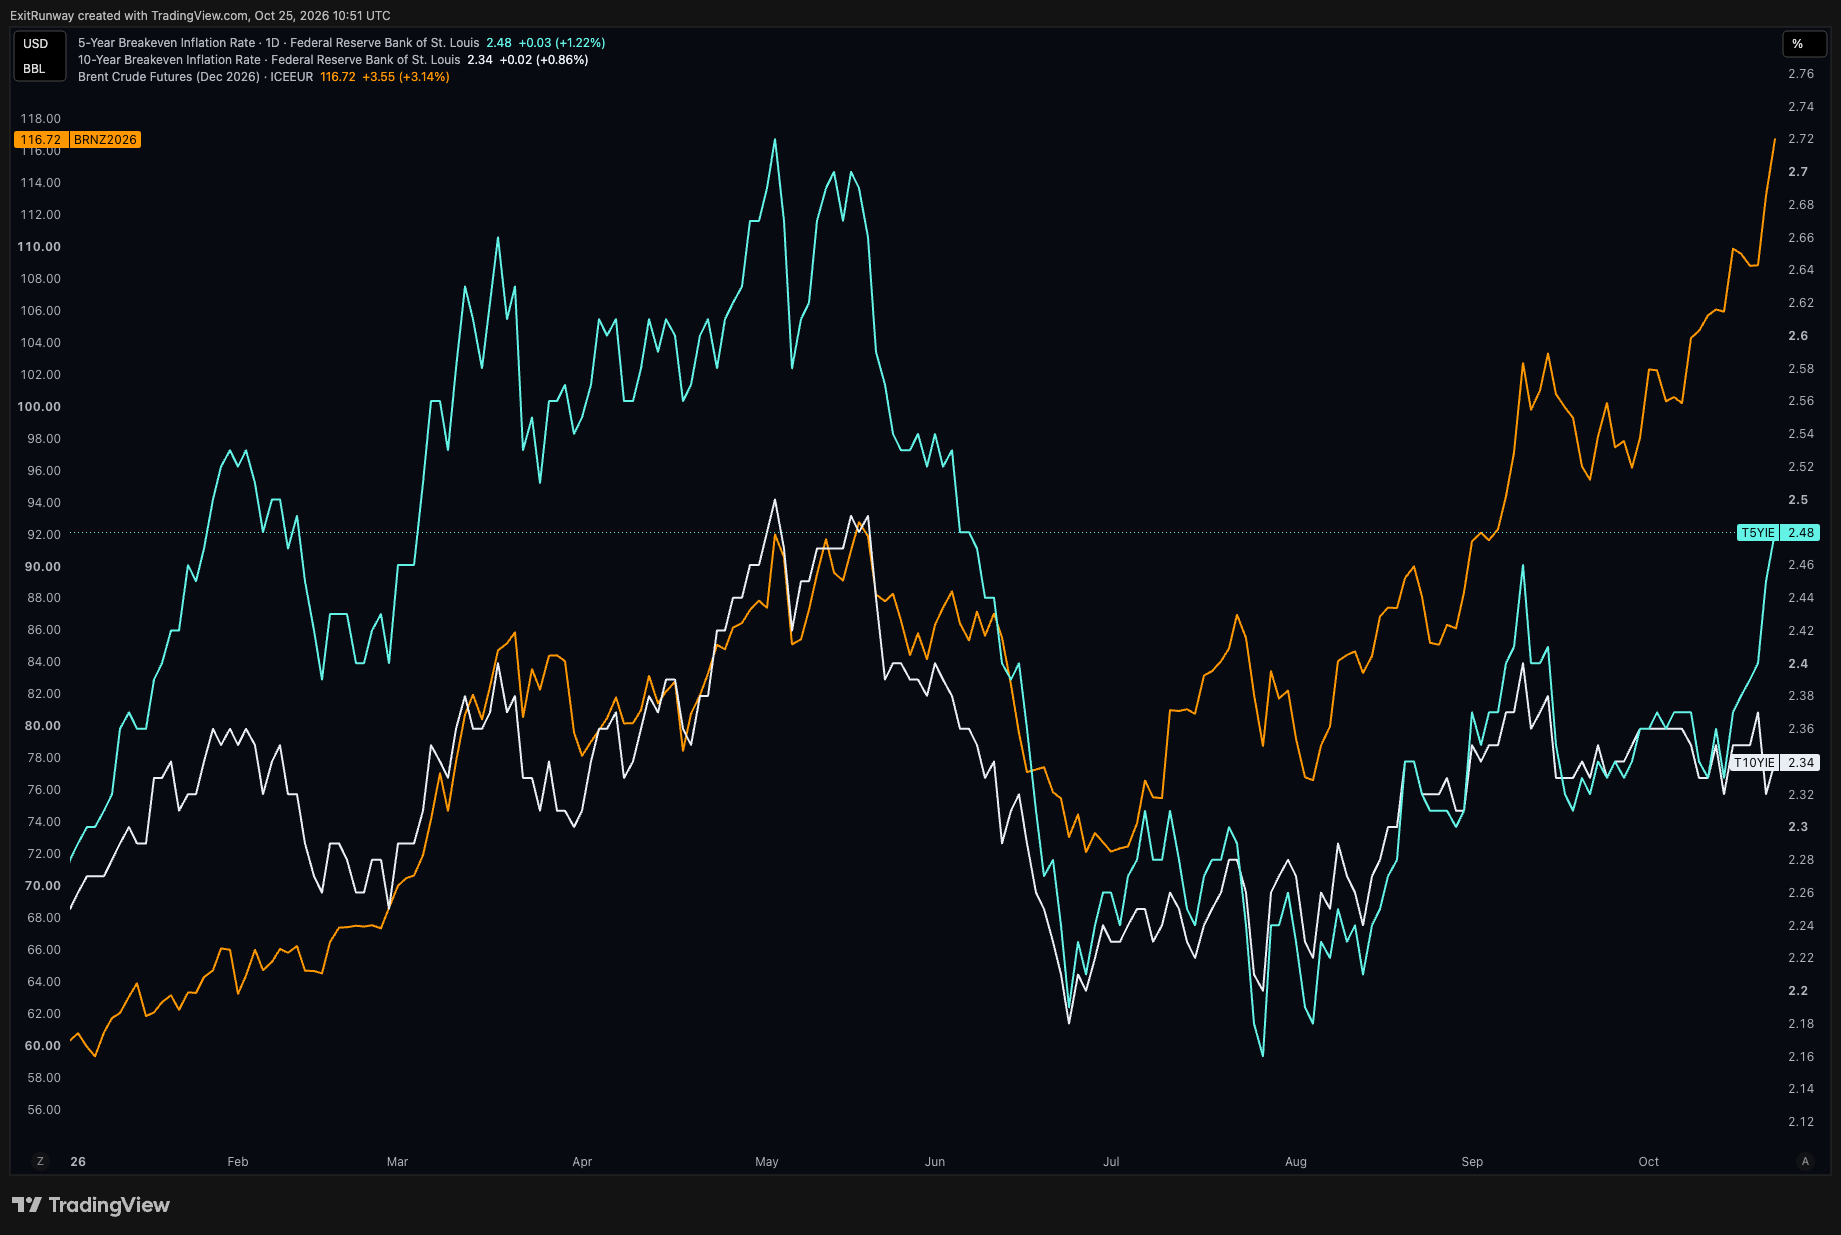
Which brings us to oil. Brent sat under $110 from Monday to Wednesday, then rose about 4% on Thursday and another 3% on Friday, about 6% on the week to about $117. US crude on the December contract rose about 4%. The causes were several, and all of them are reported, not ours. On Thursday Bloomberg and the FT had the US ordering non-emergency staff out of Saudi Arabia and Iran's foreign minister saying he saw no progress with the US. On Friday the reported drivers were expectations of renewed US strikes on Iran and Houthi attacks on Saudi Arabia. Diesel above $6 a gallon in the US has been there for weeks. That is not this week's news. Our reading is simple. Oil is the likeliest driver of the inflation signal, so oil goes to the top of the list.
Now the other side, because none of this is black and white. It was not a panic. About two thirds of the S&P 500's stocks rose on the week, 330 of 503, the typical one by about 1.4%. The equal-weighted S&P, every company counting the same, rose about 1.1% while the normal index fell about half a percent, and small companies rose 2%. The VIX ended the week at 19.45 against 19.99, lower even after Thursday's jump. The junk spread rose 0.13 on Thursday alone to 3.40%, a proper move for one day, but it is still under March's high of 3.46% and Friday's reading only comes out on Monday. Gold fell about 4% in a week when real yields fell, which normally helps it. We have no tidy explanation for that and would rather say so than invent one. So the fear is real but it is aimed. At AI, at chips and at the people borrowing to build it. Not at the whole market. And last week's sting still stands. If the fear proves unfounded, the lower long rate still helps borrowers and share prices without the bad outcome the bond market bought it for. Oil is the separate threat to that rate. A lower rate never asks why.
What does this mean? For the retirement core, nothing. The S&P 500 is about 2.5% under its record close of Tuesday 6th October and the portfolio stays on the same allocation. The core's bond leg does deserve a closer look this week, because the week was about the exact thing it is there for. The core holds a 20-plus-year US Treasury fund as one end of a barbell with Treasury bills and short-dated company bonds at the other, built so far to about a third of its target size. That fund is the hedge for a fear fall in long yields, which is what Thursday was. A 1-point move in long yields moves a fund like this about 15% in either direction. The honest downside is this week's theme. Fear and inflation at the same time is where that kind of fund is weakest, and in 2022, the inflation year, a 20-plus-year Treasury fund lost about 31% while US stocks lost about 18%. This week the inflation half showed up at five years. It did not show up in the twenty and thirty-year bonds this fund holds, where expected inflation slipped. So it is a condition to watch, not evidence that anything is hurting. The number that tells us is the ten-year breakeven. It has not moved, and we will say when it does.
For stocks, the index hides what happened. The S&P 500 fell 1.2% on Thursday, its worst day since 29th July, and about half a percent on the week. The chip index fell 6.7% on Thursday, its worst day since June, and about 3% on the week. The reported causes were a mix of Lam Research (LRCX) warning about supply, Meta Platforms (META) moving the bottom of its spending range up, and the wider worry about who funds the AI build-out. Most other stocks rose. For the second week running the selling has been aimed at one group. The two ways from here still hold. Either the fear stays inside AI and a lower long rate lets everything else catch up, or it spreads and the defensive names fall too. Consumer staples, the defensive group, jumped 3.3% on Thursday and gave most of it back on Friday. That is neither.
For bonds and borrowers, the US government borrows a little cheaper for ten years. The 30-year mortgage on Freddie Mac's weekly survey eased from 7.40% on 15th October to 7.32% on 22nd October, but most of that survey was taken before Thursday's rally, so next Thursday's reading is the first that can show whether the fall reaches a household. Junk-rated companies got the opposite. Their spread widened 0.09 from Friday 16th to Thursday, and the investment-grade spread, what solid companies pay, widened a touch too, 0.85% to 0.89%. The borrowers who most need a lower rate are getting the least of it. The spread took back most of what the government saved.
The collision, written down plainly
For our trading book, the collision is worth writing down plainly. The macro says funding is the weak link in the AI trade, and the book is long several AI names and one that lives on funding. Here are the lines that bear on this story as of Friday 23rd October's close and how they are hedged. They are not the whole book.
The main hedge is a short in the Invesco QQQ Trust (QQQ), there to level the book against its longs in AI and tech. On top of it sits a VIX call, an option that pays if volatility jumps. We sold half of it when the VIX spiked above 22 during Friday 16th October, and the rest stays as a small hedge working together with the QQQ short. We expect volatility to remain in the market, and if fear returns and markets sell off, the VIX goes up and the call gains. We expect a bounce in stocks after the selling of the last week and a half, but it all hinges on oil and the credit market, and with oil this high credit spreads get no help, so whether the bounce comes remains to be seen.
The one neocloud line is IREN (IREN), a borrower that builds data centres and rents out the computing, and it is a bet on a small bounce within the group. Our view is that IREN looks fundamentally stronger than CoreWeave (CRWV) and Nebius (NBIS), which is why we picked it as the name to own for a bounce in the group. This week it fell 7.7%, Nebius 4.1% and CoreWeave 11.7%. The chip longs are Micron (MU), Nvidia (NVDA) and Qualcomm (QCOM). Applied Optoelectronics (AAOI) is a long too, about 2.1% of the book, covering the fibre-optic corner of the AI build-out. We sized it small because it is speculative and volatile, and like the neoclouds it needs reasonable access to credit. With the credit and bond markets not playing along these names are under pressure, but the sector matters and they have already been sold hard, so we think it is a fair time to hold some allocation for a bounce.
On oil the book is long Transocean (RIG), bought on Friday 23rd, and short CVR Energy (CVI), a refiner. With the CVI short we are betting on the crack spreads coming down over the next weeks or a couple of months. The crack spread is the gap between the crude a refiner buys and the fuels it sells. The refiners have rallied a lot on a crack spread far above normal, and when it comes back toward normal as oil eases they should sell off. It could take time to play out, and it is the same shape as our Moderna (MRNA) short and the CrowdStrike (CRWD) short we closed on Thursday 22nd October. What proves it wrong is the spread staying wide as oil falls.
In Asia the book holds the iShares MSCI South Korea ETF (EWY), bought on Friday 23rd, and the HSBC Hang Seng Tech UCITS ETF (HSTE). It holds no bonds, no gold and no short on crude itself. The long-bond hedge sits in the retirement core, not here.
Meta (META) gets a line after the week it had. We hold no position now and are watching. We were long earlier and sold half early on the way up, then tried a short when it looked overbought and closed that early too. We were wrong on timing both ways, albeit both trades were profitable. Every change to any of these lines is posted after its fill, never before.
So the swing factors have swapped places. Oil is first now. Oil feeds the inflation signal, and the inflation signal decides whether the fall in long rates is a clean fear story or the one mix with no good answer. The junk spread is second. Thursday's 0.13 was a proper jump, but Thursday's reading is still under the line we drew. Both head WHAT WOULD CHANGE OUR MIND.
A quiet week this is not
The gap between the yield on a normal Treasury and the yield on an inflation-protected one of the same length. Imagine a five-year Treasury paying 5% and a five-year inflation-protected one paying 2.5%: the breakeven is 2.5%, the inflation rate at which the two bonds pay the same, so the inflation the bond market expects over those five years. The actual five-year one stood at 2.48% on Friday. It moves every day, and it is the number that showed oil feeding into five-year pricing this week, in our reading. The ten-year version is the one to watch next: it has not moved.
The week's data points, each with a verdict. Meta (META): revenue $64.6bn, up 26%, the 2026 spending range narrowed to $135-145bn from $130-145bn, so the bottom moved up, free cash flow for the quarter negative at minus $2.1bn, and a new non-voting share class from January 2027. The stock fell 7.0% on Thursday and 9.4% on the week. Sold after it said it would spend more. Tesla (TSLA) spent $4.7bn in the quarter against about $7.5bn expected and produced $1.5bn of cash. It fell 3.1% on Thursday and was up 4.9% on the week, but all of that gain came before the result. Sold after the news. SpaceX (SPCX): revenue $14.6bn, up 161%, and a $4.4bn profit against a loss a year earlier. Reassuring for the company. Lam Research (LRCX) guided higher, to $8.6bn, but not by as much as hoped, and reportedly flagged supply limits. It fell 11.8% on Thursday. Our reading is that a lot was already priced in. The 20-year Treasury auction on Wednesday 21st went well, 2.73 bids for every bond sold and dealers left holding 10%, so the long end found buyers before Thursday's rally, not only during it. The five-year inflation-protected auction on Thursday 22nd was mixed, a real yield of 2.37% and 2.41 bids per bond, the weakest since April 2025. Demand for inflation protection was there, not clamouring. Pending home sales fell 7.3% in September to what HousingWire called the lowest in the history of the index, and housing starts fell 5.2% to 1.221m, a third monthly fall. Both came out on Tuesday 20th and the 30-year mortgage is still above 7%. And prediction markets, Kalshi and Polymarket, put a hike at Wednesday's Fed meeting at about 6% as of Saturday 24th. A hike is priced as unlikely, so the reaction will be to the words.
The week ahead, in US Eastern time, and a heavy one.
| Day | What | Why it matters |
|---|---|---|
| Mon 26th Oct | Friday's junk spread reading is published | The first look at whether Thursday's 0.13 jump carried into Friday |
| Tue 27th Oct | Fed meeting begins. SK Hynix (000660) results, Tuesday evening US time | Hynix (000660) makes the memory chips the AI build-out runs on: the first big chip read of the week |
| Wed 28th Oct | Fed decision (2:00 pm). Microsoft (MSFT) results after the close; Alphabet (GOOG) expected the same evening | A hike is priced at about 6%, so the words carry the day. Microsoft (MSFT) and, expected, Alphabet (GOOG) report the same evening |
| Thu 29th Oct | Q3 GDP, first estimate, and September PCE, the Fed's preferred inflation gauge (8:30). Amazon (AMZN) after the close, and Intel (INTC) | Growth and prices in one morning, the day after the Fed; Amazon (AMZN) is the third big spender in two days |
| Fri 30th Oct | The October close. The December Brent contract expires | The month-end close. Next week's oil price is quoted off a different contract |
Further ahead.
| Day | What | Why it matters |
|---|---|---|
| Mon 2nd Nov | Apple (AAPL) results after the close | The last of this round of giants to report |
So the Fed decides on Wednesday, Microsoft (MSFT) and, expected, Alphabet (GOOG) report that evening, Amazon (AMZN) the next day, and the month closes on Friday. Through all of it we watch two things. Oil, because it decides whether the inflation signal reaches the ten-year. The junk spread, because it decides whether the fear stays in one corner. A quiet week this is not.
Rotation, second week running
The retirement core does nothing. The S&P 500 sits about 2.5% under its record close and the portfolio stays on the same allocation. That is the whole instruction. The rest of this section is why a quiet instruction fits a loud week.
THE MACRO gave the headline: two thirds of the index up in a week the index fell. Here is what sits under it. Eight of the eleven sector groups rose. The three that fell were tech, down a touch, industrials, down 1.9%, and communications, down 4.4%, and communications is where Meta (META) lives. The equal-weighted S&P beat the normal index by 1.6 points this week. Last week it won by 2.5 points, the widest week in our data going back to the start of 2025. Over the two weeks the equal-weight is up 1.6% and the normal index is down 2.4%, four points apart. Thursday was the sharpest version yet. The equal-weight rose 0.7% on a day the index fell 1.2%, a gap of 1.9 points, the widest single day in our data. So the rotation slowed this week. It did not stop, and Thursday made it plain.
Two cautions. The Russell 2000 rose 2% this week, which sounds like the catch-up we described last Sunday. Over two weeks it is still down 1.1%, because last week it fell 3%. The spring has not sprung. It has stopped compressing. And consumer staples, up 3.3% on Thursday and down 1.9% on Friday, are up 5.8% over two weeks. That is money moving to the safest corner of the stock market, not out of it.
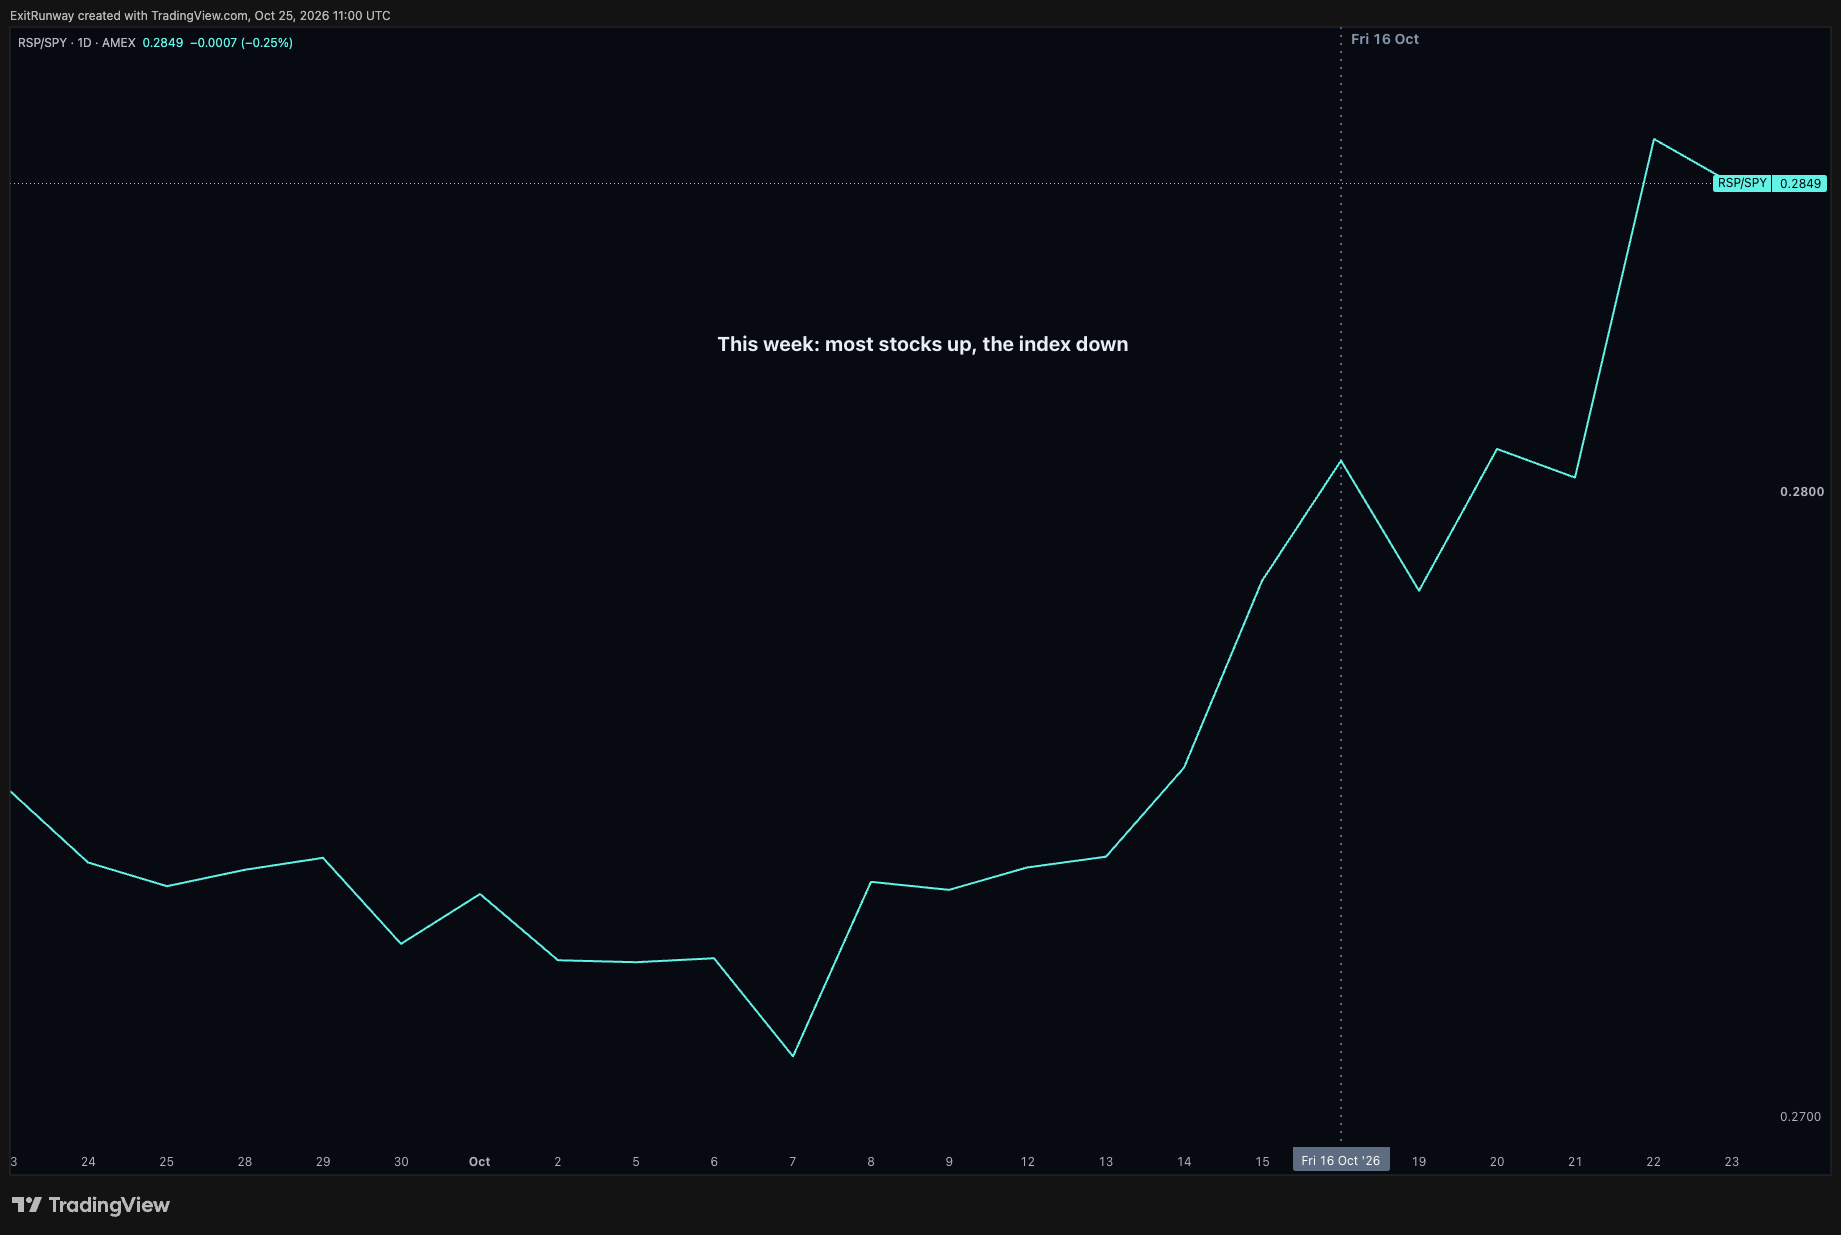
What does this mean? For a saver, the index number hid the week. Imagine two funds. One holds the S&P 500 by size, so the biggest companies count most, and that is the fund almost everyone owns. The other holds the same 500 companies in equal amounts. The first fell this week. The second rose. The companies did nothing different. What differs is how much of the fund each one is, and the AI names are the biggest names in the index. Our reading is that this is a rotation, not a rout. The money that left AI stayed in stocks. A rout looks different. The index falls and the safest names fall with it, 3% or more, or fewer than three of the eleven sector groups rise. Neither happened, and the rout test sits in WHAT WOULD CHANGE OUR MIND with a number on it.
So the core does nothing because nothing in it needs doing. It is not built to pick the side of a rotation. Our trading book is long the names that were sold, AI and chips. That is what the QQQ short is for, and its lines are in THE MACRO.
Who pays for it
The question has moved. A year ago it was whether the demand for AI computing was real. Our view is that it is. This week four companies put a number in front of the market and were marked against a new sheet. Who pays for the build-out, and is the pay-off in the numbers yet.
Meta (META) first. Revenue of $64.6bn, up 26%, then a 2026 spending range of $135-145bn, from $130-145bn. The top did not move. The bottom moved up. Free cash flow for the quarter was negative, minus $2.1bn, and a new non-voting share class comes in January 2027. Down 7.0% on Thursday and 9.4% on the week. Sold after it said it would spend more. Our reading is that the spending did it, not the revenue.
Tesla (TSLA) spent $4.7bn in the quarter against about $7.5bn expected and produced $1.5bn of cash. Down 3.1% on the day. Spent less, sold anyway. Our reading is that the market did not take lower spending as discipline. It took it as less to show for later.
SpaceX (SPCX) had revenue of $14.6bn, up 161%, and a $4.4bn profit against a loss a year earlier. The stock rose 7.8% on Wednesday, after its results. It was the only one of the four bought on its own numbers. That lasted a day. Thursday took 9.1% off it, more than Meta lost. Sold with the rest of AI. It ended the week up 1.0%, about where it started. A lot of travel for very little distance.
Lam Research (LRCX) makes the machines that make the chips. It guided higher, to $8.6bn, but not by as much as hoped, and reportedly flagged limits on how much it can supply. Down 11.8% on Thursday. Our reading is that a lot was already in the price. Better was not enough.
Put the four together. Spend more and you are sold. Spend less and you are sold. Make money and you are bought for a day, then sold with the group the next. Guide higher but not high enough and you are sold hardest. Harsh marking. The market is no longer funding the build-out on trust. It wants the pay-off in the numbers now, and it wants to know who is paying. The bond market said the same thing in THE MACRO, from the other side.
The big spenders this week
Not all of them, every week. We cover the ones our book holds, and Meta because of our own history in it, and rotate the rest.
Nvidia (NVDA) slipped about 1.5% on the week to 210.96, and 4.4% on Thursday alone. It is down 8% over two weeks. It sits about 12% under its record close of 239.24 on Tuesday 6th October and about 3.6% above its 200-day average of 203.67, the average close of the last two hundred sessions. It is below its 50-day, 222.48. The long trend holds and the short one does not. Our book is long Nvidia. Its results date is not announced yet.
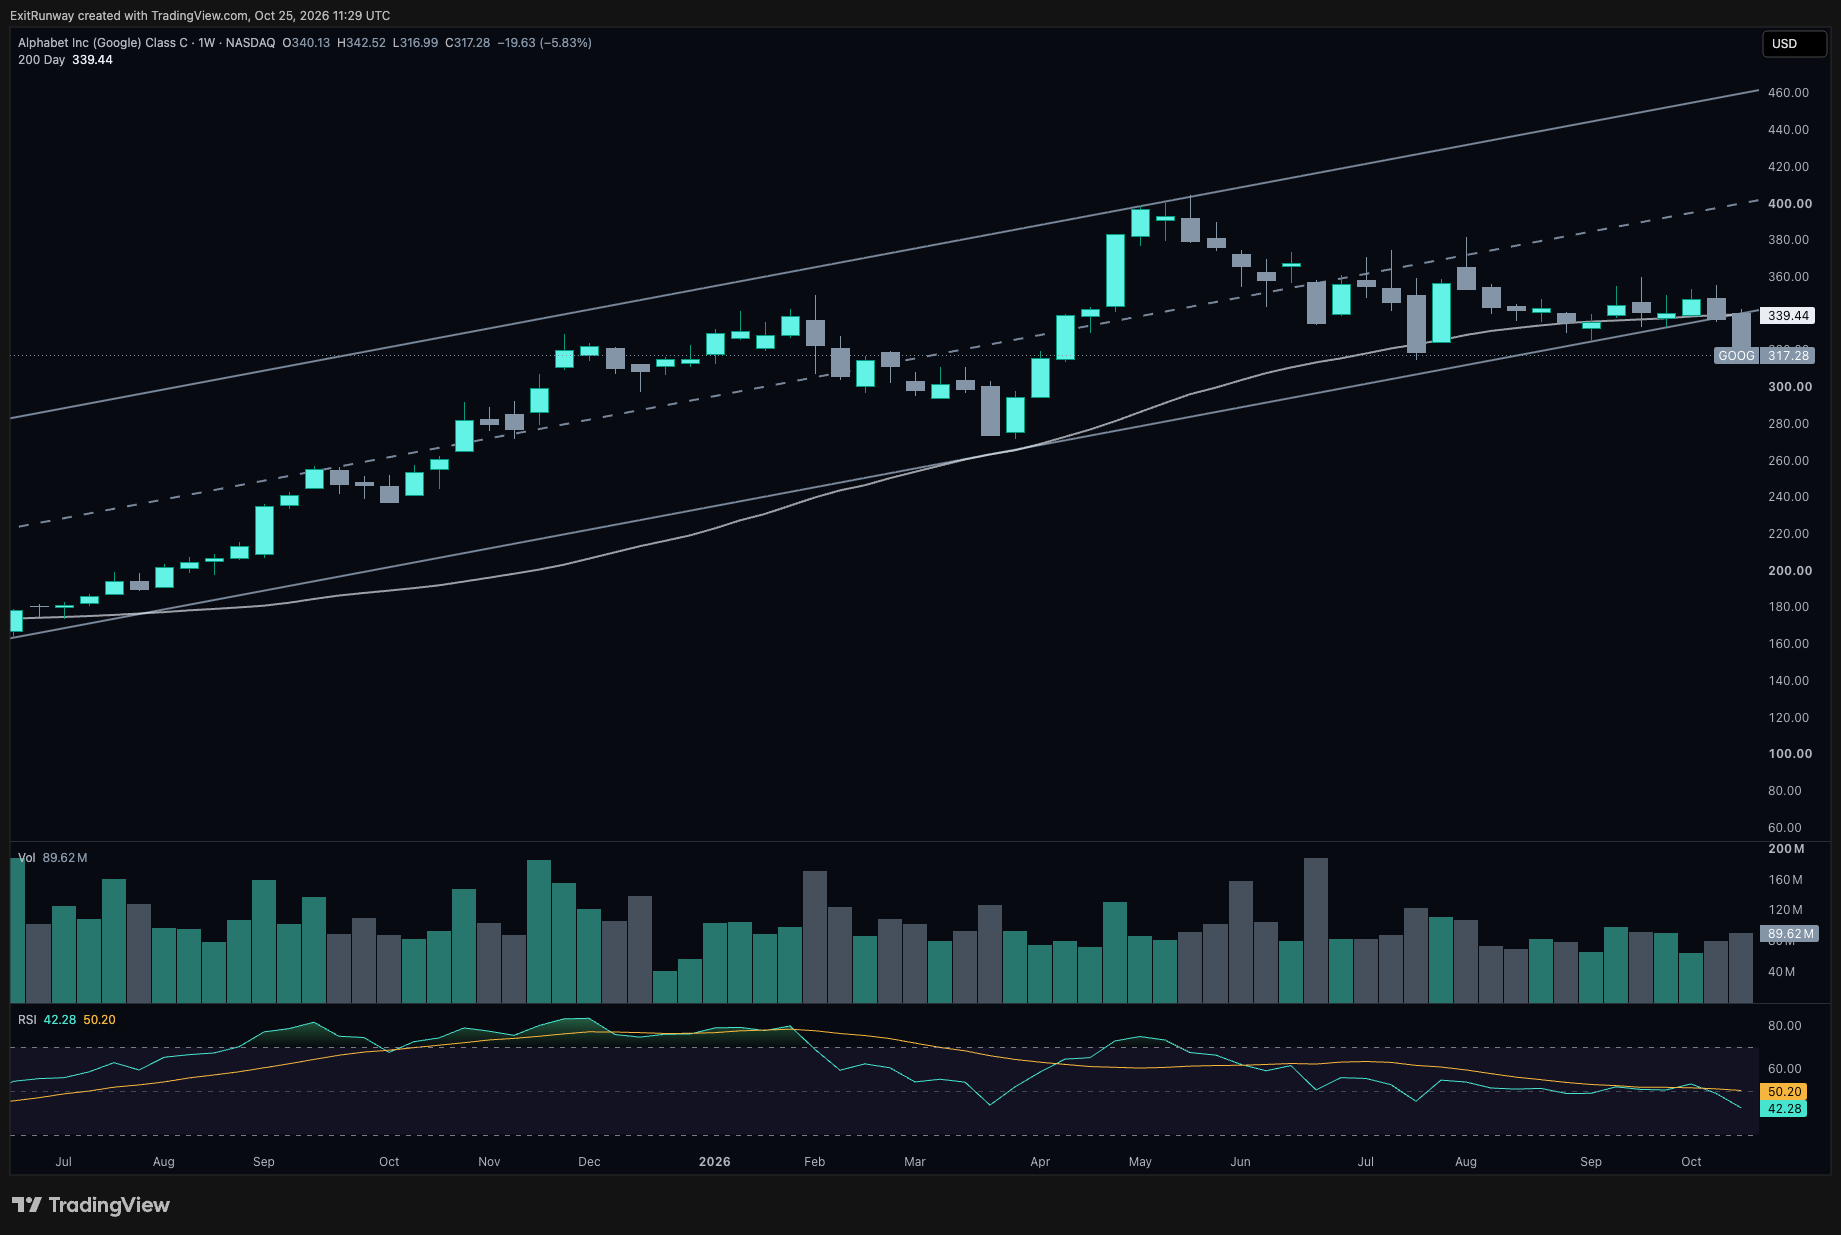
Alphabet (GOOG) needs the most words, because we hold it and we have a test on it. The stock fell about 6% on the week to 317.28, and 3.1% on Thursday. It closed about 6.5% under its 200-day average of 339.44, about $22 below it, four sessions running under the average after one day back above it on Monday. It is about a fifth under its record close of 399.04 from Wednesday 13th May. On our weekly chart it also closed under the floor of the rising channel we had drawn under it. The channel is our drawing and a reader cannot score it. The 200-day is a public number, so that is the one we score.
Here is our plan, for our own line. Alphabet has to close back above its 200-day average, about $339 by Friday 30th, and back inside the channel on our weekly chart, by Friday's close. If it does, we stay. If it does not, we close the line, and the fill is posted in the book channel after it happens, never before. It is our rule for our book and nothing more. Results are expected on Wednesday 28th after the close, two sessions before the test ends, so they will most likely decide it. We score it next Sunday either way.
Meta. We hold no position now and are watching. We were long earlier and sold half early on the way up, then tried a short when it looked overbought and closed that early too. We were wrong on timing both ways, albeit both trades were profitable. It closed Friday at 642.62, about 1.6% above its 200-day. Watching is the word.
The rest rotate. Amazon (AMZN) reports Thursday 29th and gets its turn next issue. Apple (AAPL) reports Monday 2nd November and follows. Microsoft (MSFT) is not in our book. It reports Wednesday 28th after the close, the same evening as the Fed. A full evening.
Good news, falling stock
Good news. Falling stock. Moderna (MRNA) is this week's lesson in what "priced in" means, and the lesson is sharper than the headline.
The news was good. Merck (MRK) and Moderna's personalised vaccine for melanoma, given with Merck's Keytruda after surgery, cut the risk of the cancer coming back or death by 42% against Keytruda alone. The patients had stage IIB to IV melanoma that had been removed, over a median follow-up of 24.6 months. The number behind the 42% is a hazard ratio of 0.58. A ratio of 1 means no difference. 0.58 means the risk in the vaccine group ran at 58% of the other group's. Lower is better. After two years 82.2% had not relapsed, against 70.0%. Overall survival is not mature yet. So not a cure, and not "cancer" in general. Melanoma, after surgery, against the current standard, and a clear win on the main measure.
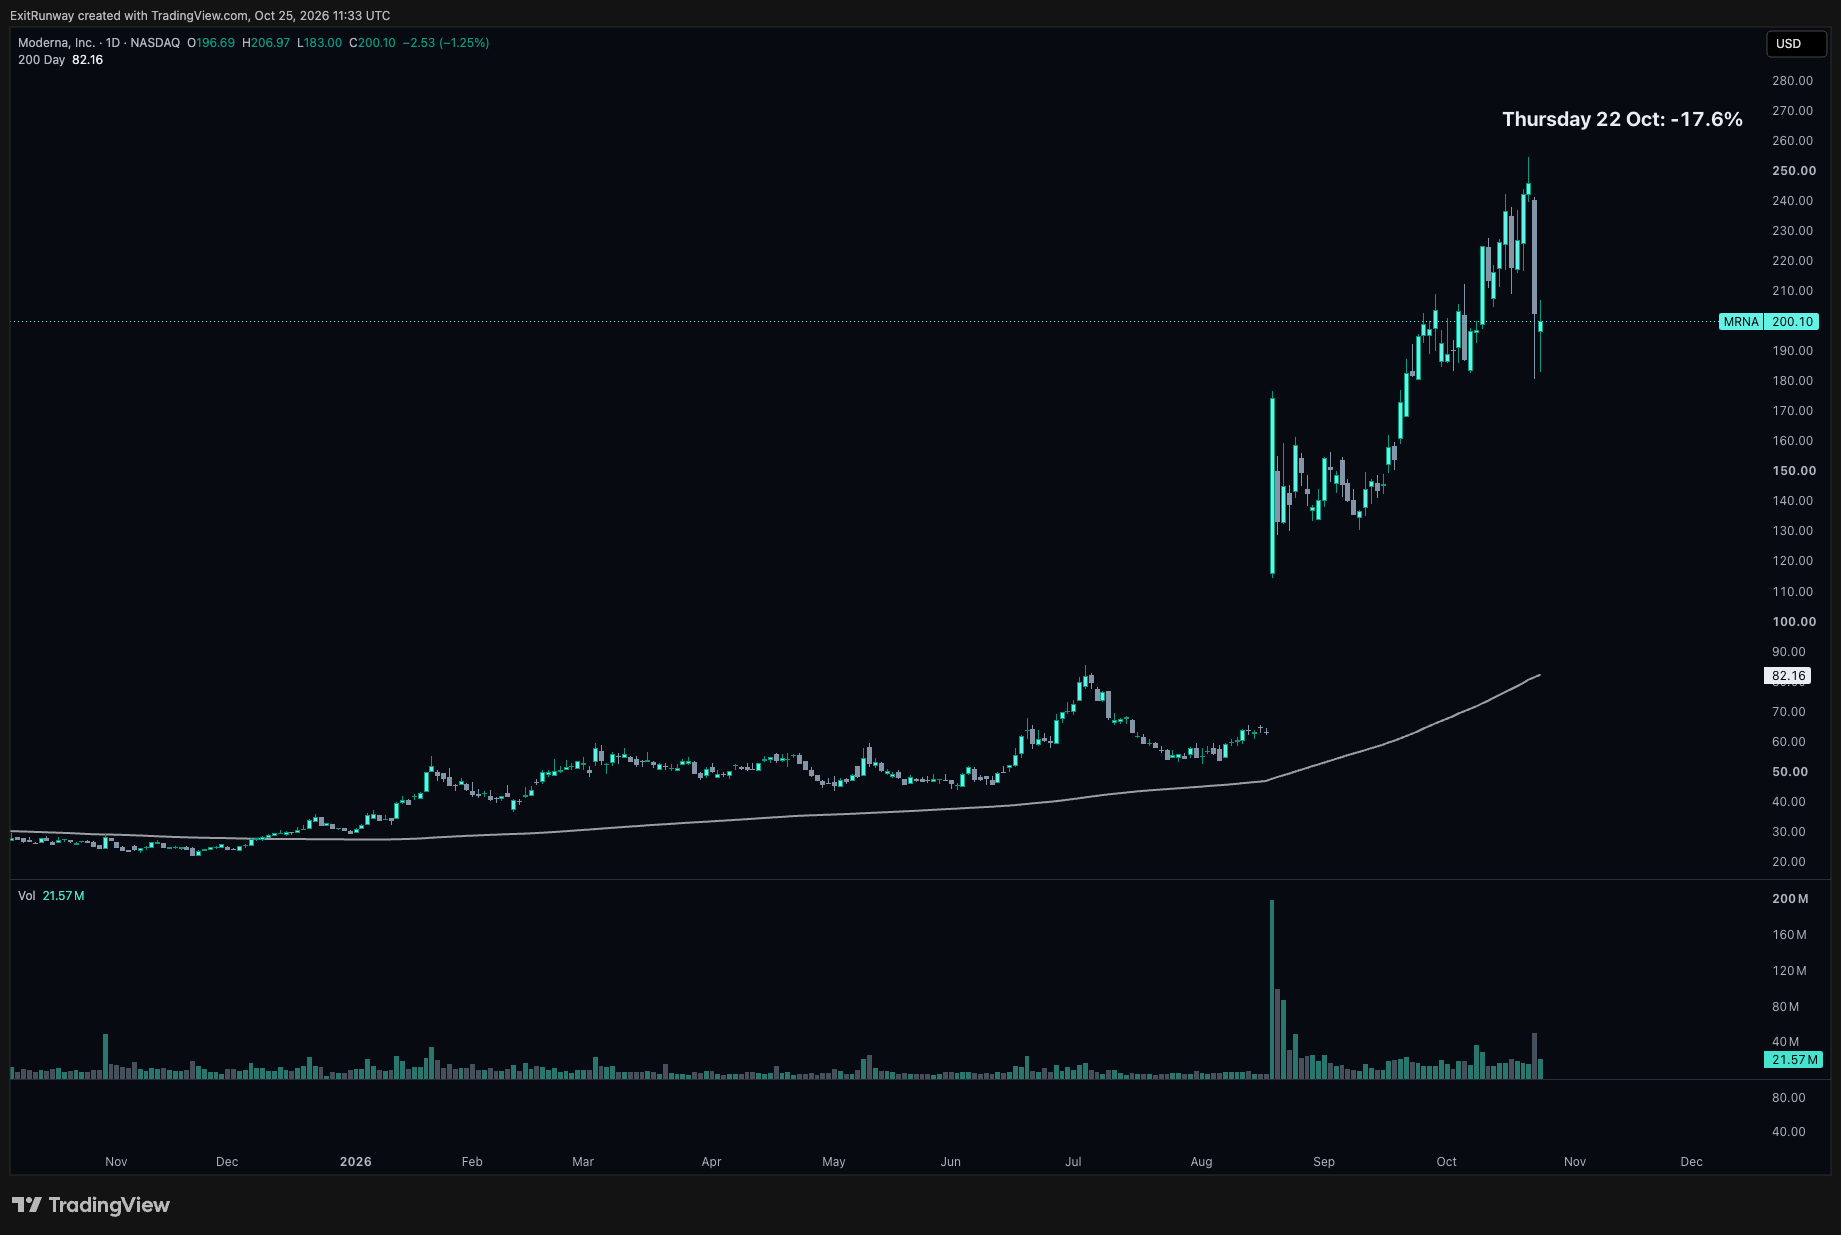
The stock fell about 18% on Thursday, from 245.81 to 202.63, and was down about a quarter at the low. It closed Friday at 200.10, down 8.2% on the week.
Why. The banks had published their bars, as reported. Citi said 0.72 or better would be positive and 0.65 or better a clear win. UBS and William Blair were at about 0.65. 0.58 cleared every one of them. But the banks' bars were not where the price was. BioSpace reported that analysts had come to hope for below 0.60, and 0.58 is just under it. RBC put what investors hoped for at 0.50 to 0.59 and called 0.58 the low end of expectations. Our reading is that the anchor was the earlier and smaller trial, 157 patients, with a hazard ratio of 0.51. The result was 0.58. It cleared every bar. It landed at the low end of the hope. And it was worse than 0.51.
Now look at how far the stock had come. That is "priced in" made visible. On 19th August Moderna said the trial had met its goals and gave no numbers. The stock rose 177% that day, from 62.96 to 174.38. It then rose another 41% to 245.81 on Wednesday 21st October, its high close of the year, before anyone outside the trial knew the hazard ratio. It had started the year at 30.86. Even after Thursday it closed about 16% above the August close. The fall took back about two thirds of the second leg and none of the first.
The data came out early. By the reports it was posted on Thursday in error and pulled. The full presentation was Saturday 24th at ESMO, the cancer conference, the day before this issue. Saturday added one detail. In the first six months the vaccine group did about as well as the other group, a ratio of 0.99, and after that the ratio was 0.42. That is a secondary cut, not the main result. The stock has not traded since. Monday 26th is the first reaction. We do not know what it will be.
Our side, said carefully. We are short Moderna, about 2.3% of the book at Friday's fill. We had covered most of it before the data came out, a fifth of it on Tuesday and half of what was left on Thursday morning, to cut risk before the weekend event, because a stock can gap up on good data. The data came two days early. So Thursday's fall met a far smaller position than the one we held a week before. That is the timing error, and it is ours.
The lesson. A price is a bet on a number. Not on good or bad. On a number. When the result lands, the move tells you what the number was. Moderna cleared every bar the banks had published and fell a quarter at the low, so the bar that mattered was not the one the banks wrote down. It was in the price. Ask what number a stock needs, not whether the news will be good. If you cannot name the number, the price is making the bet for you.
What would change our mind
A check is a number, a date and a direction, written down before the week so we cannot move it after. Last Sunday's five, scored on Friday 23rd's close, and the one carried from the issue before.
| Check from issue 3 | The line | Where it closed | Score |
|---|---|---|---|
| Five-year breakeven rises 0.10 from 2.37% with Brent above $105 | 2.47% | 2.48%, up 0.11; Brent above $105 all week | Yes, just over the line |
| Junk spread closes above 3.46%, its high for the year | 3.46% | 3.40% on Thursday 22nd, the reading the check named | No |
| S&P 500 falls and staples fall 3% or fewer than half its stocks rise | both legs | S&P down 0.47%; staples up 0.73%, 330 of 503 up, 8 of 11 sectors up | No, neither leg fired |
| Ten-year yield above 5.24% with the junk spread under 3.23% | 5.24% and 3.23% | 5.00% and 3.40% | No |
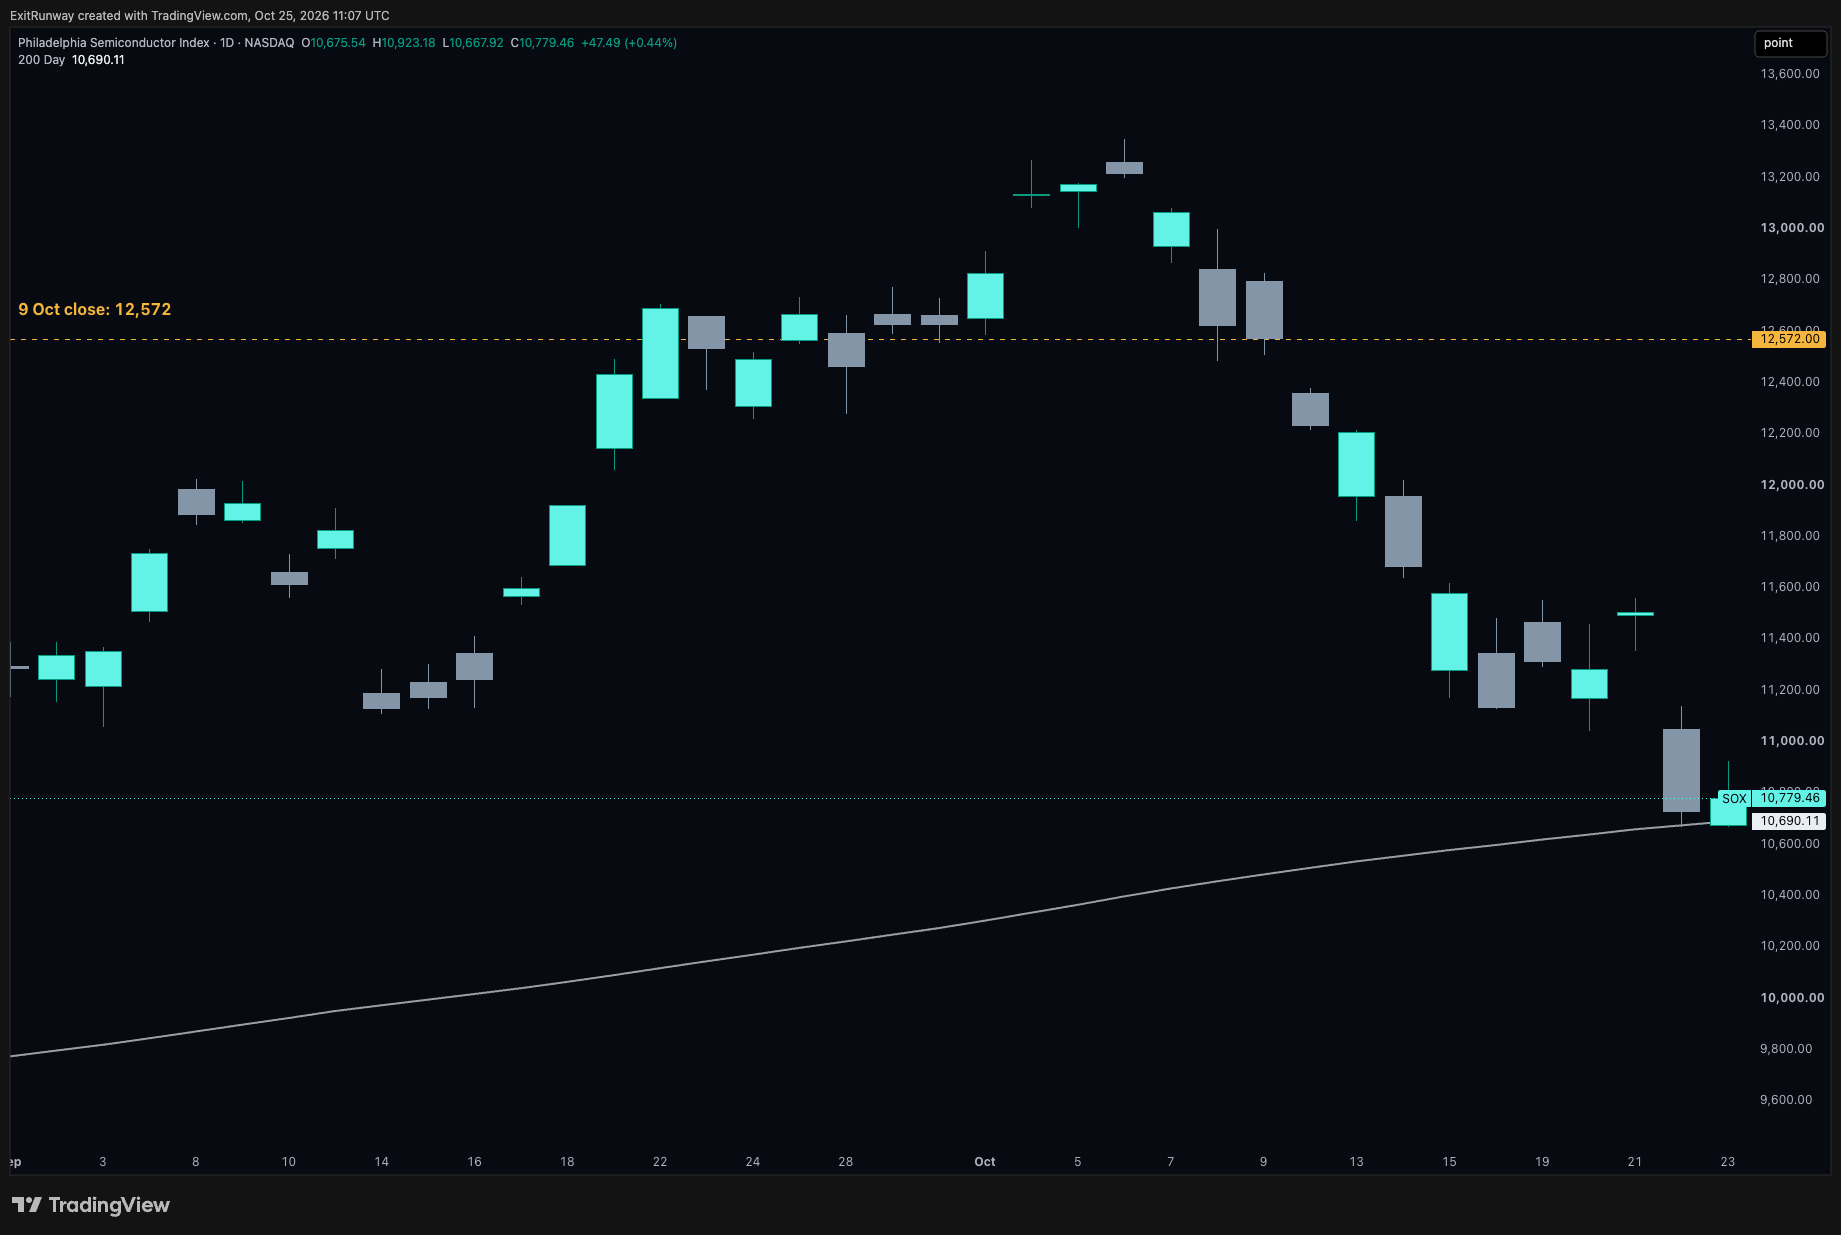
| Chip index closes above 12,572 | 12,572 | 10,779 | No |
| Carried from issue 2: equal-weighted S&P beats the normal S&P by 2 points over a month from Friday 9th October | 2 points | 4.03 points ahead after two weeks | Pending, scored about Monday 9th November |
One yes, four no, one pending. The yes is why oil leads the new list. The new checks are read at Friday 30th October's close, the junk spread on Thursday 29th's reading because Friday's comes out the following Monday, and scored on Sunday 1st November. One note on the oil number. The December Brent contract expires on Friday 30th. The January contract closed at 111.70 on Friday against December's 116.72, so a check on the front month would drop about $5 on the roll alone. Ours names the January contract.
| New check | The number and the direction | Where it starts | What it would mean |
|---|---|---|---|
| N1 | Five-year breakeven falls back under 2.37% while January Brent (BZF27) stays above $105 | 2.48%; January Brent 111.70 | Oil is not feeding the five-year inflation signal: the inflation half of THE MACRO was noise |
| N1b | Ten-year breakeven rises 0.10 or more, to 2.44% or higher, with the ten-year yield higher on the week | 2.34% and 5.00% | Inflation has reached the long end and the fear bid is over: the case where the core's long-bond leg is weakest |
| N2 | Junk spread closes above 3.46%, its high for the year; or back under 3.27%, its Wednesday 21st reading, with the ten-year still near 5% | 3.40% on Thursday 22nd | Above: the fear is spreading beyond AI. Under: Thursday was relief, not fear. If Friday 23rd's reading moves the start, we say so |
| N3 | Chip index closes under its 200-day average, about 10,770 on Friday 30th and rising daily; or back above 11,506, its Wednesday 21st close | 10,779; 200-day 10,693 | Under: the AI selling has broken the trend. Above: Thursday was a flush |
| N4 | In a week the S&P 500 falls, staples (XLP) fall 3% or more, or fewer than 3 of the 11 sector funds rise | 8 of 11 rose; staples up 0.73% | The safe names are falling with AI: the rotation has become a rout |
Alphabet (GOOG)'s test lives in THE AI TRADE, where we hold it, and is scored there. Five numbers, one Friday. We will say which fired.
The free community
Leave your email and your Discord invite is in the confirmation email we send you straight away. The Weekly follows every Sunday.
Send my invite »