- Our read: a very loud week at the stock level and a very quiet one at the index level. The FED held, the bond market did next to nothing, and underneath a calm looking index the market went through the biggest companies on the planet one at a time asking a single question .. who is paying for this AI build out from their own cash and who has to borrow or issue stock to cover it? Alphabet (GOOG), Meta (META) and Amazon (AMZN) are in the second group and were sold, Microsoft (MSFT) is in the first and barely moved. Demand was NOT the problem, 3 cloud businesses accelerated in the same week
- Retirement core: October closed at 7,580, under September's close and under the momentum line as we published it in issue 2 on 9th October, about 7,633. On the data the momentum half of our rule has turned to caution, and caution on its own is a watch not an action, so the allocation does not change
- The one number: 6 points. That is how far the average S&P 500 stock beat the index in October, equal weight +4.95% vs the index -0.93%. Nothing inside the fund changed except which names got sold, and the names sold were the AI heavyweights at the top of it, Alphabet, Meta, Nvidia (NVDA) and Amazon, while Microsoft and Apple (AAPL) went UP
- The one date: Tuesday 3rd November, the midterms. Apple and Palantir (PLTR) report the evening before, Monday 2nd, AMD on the Tuesday and Qualcomm (QCOM) on the Wednesday, all after the close, and the October jobs report lands Friday 6th at 8:30 am Eastern. Clocks went back in the US on Sunday so Eastern is now 5 hours behind UTC
- Also inside: the chips rallied 6.85% in 4 days and gave the lot back in one after Intel (INTC); software was sold where growth came in under what the price assumed; the lesson is free cash flow and how a company can grow 39% and still run out of it; and our own Alphabet test from issue 4 failed, which THE AI TRADE says plainly
The Fed did its bit, the market did the restthe Fed did its bit, the market did the rest
What a week for anyone who still thinks the index tells you what happened. A FED meeting, a GDP print, a PCE print and 3 of the largest companies on the planet reporting inside 5 sessions, and the bond market slept through the lot .. the 10yr went from 5.00 to 4.94, a whole 6bps, the 2yr gave back 13bps to 4.56, junk spreads (the extra yield a junk rated borrower pays over treasuries) actually came IN, oil moved less than $2 all week and the VIX finished Friday at 19.42 against 19.45 the Friday before. Had one been staring at nothing but the macro screens the only honest conclusion would have been that nothing happened, and at the index level that's true. Underneath it this was one of the more instructive weeks in a long time, because the market went through the biggest spenders in AI one at a time and asked each of them the same question .. are you paying for this from your own cash, or are you coming to the debt and equity markets to do it?? That is our reading of what split them and it gets the full treatment in THE AI TRADE. As for us, the retirement core reads a month end close and nothing else, and these 5 sessions gave it no reason whatsoever to do anything ahead of time.
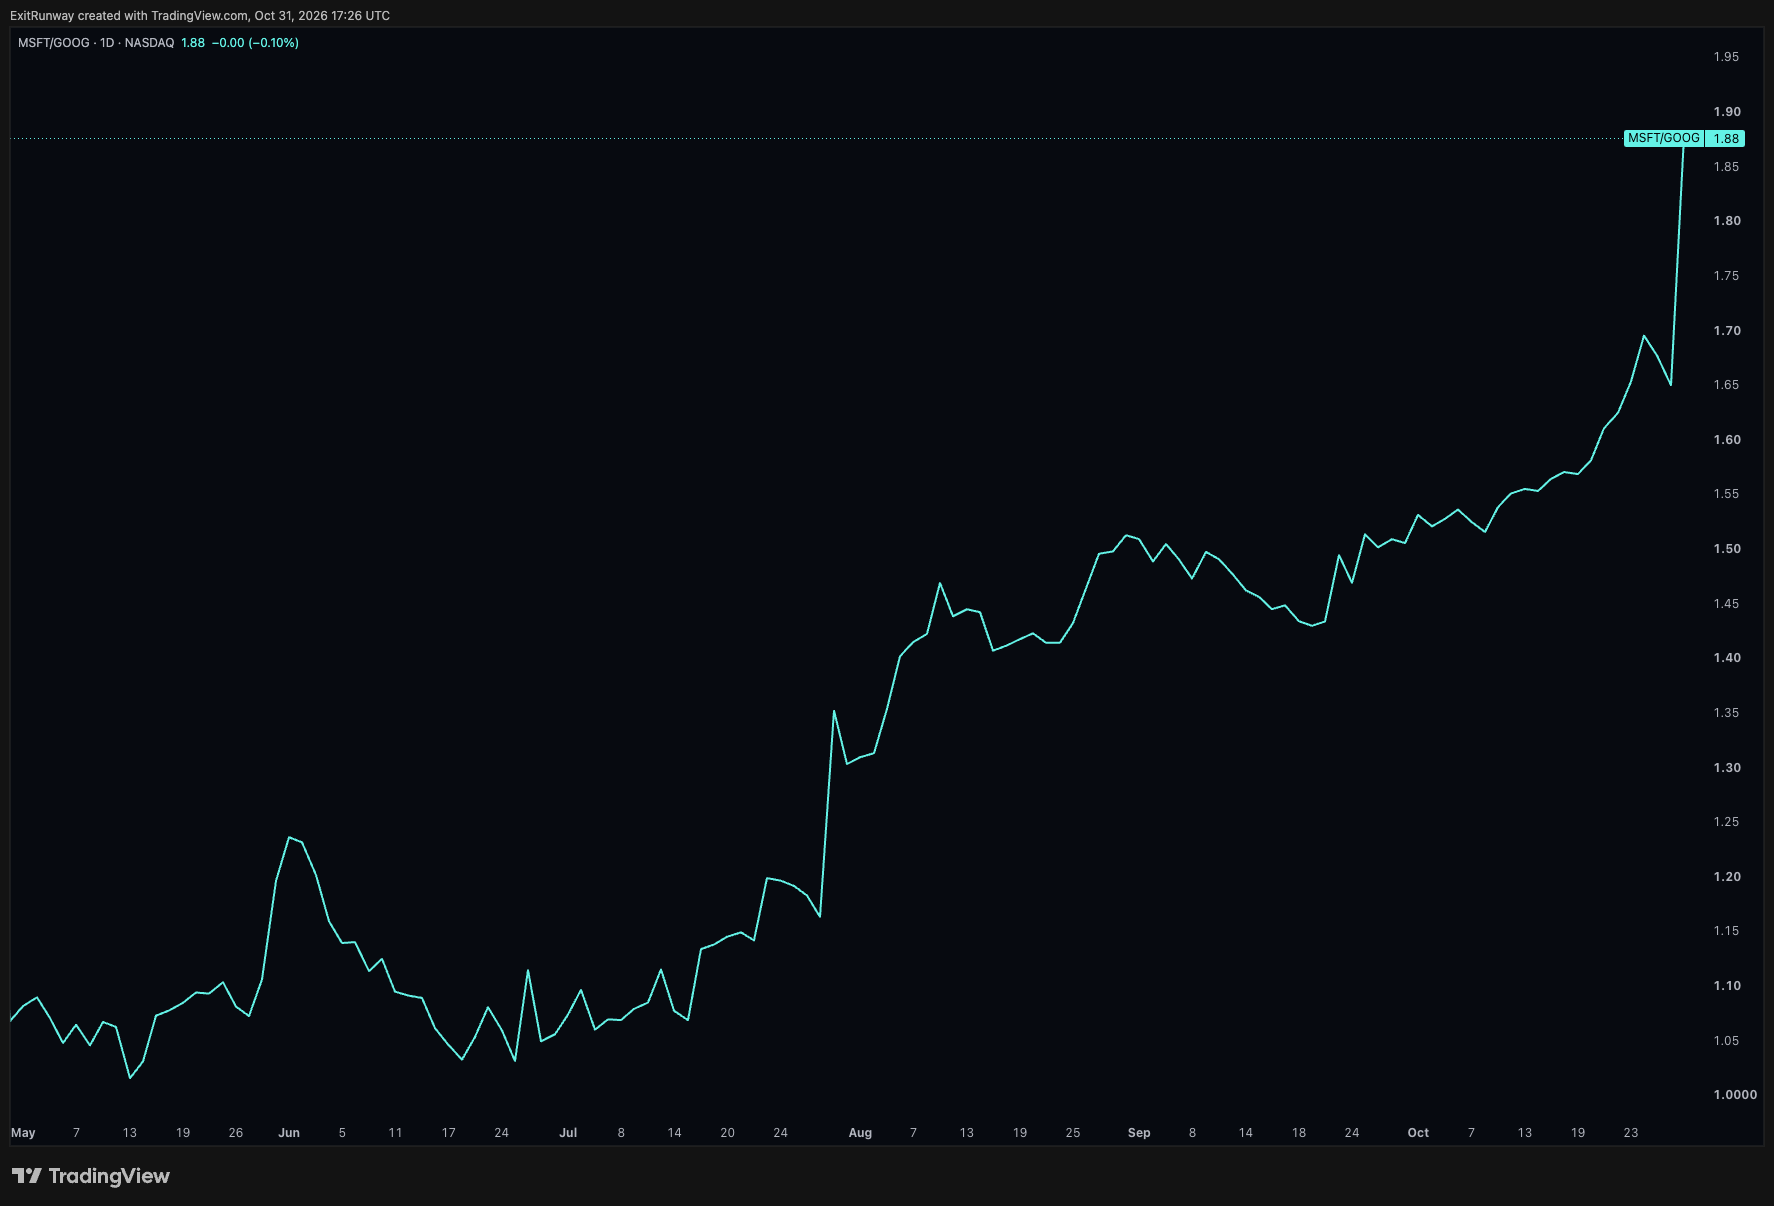
Now for the popular version. Big Tech blew up, the AI bubble has popped, the market is in trouble. It's a tidy story, and the first part is true of some of Big Tech, Alphabet had a dreadful week, but the last part fails on the arithmetic before one even gets to the argument. The average stock went UP this week, equal weight +0.82% with 9 of the 11 sectors higher, while the index slipped 0.57%, so "the market is in trouble" is a statement about a handful of enormous companies and not about the market. Nor did demand go anywhere, in fact it accelerated everywhere one cared to look .. Amazon (AMZN) grew AWS 39% from 37% last Q, and 37% was already a pace the company had called its fastest in 18 quarters, Microsoft (MSFT) took Azure to 48% from 43%, and Alphabet (GOOG) grew cloud 103%. Three cloud businesses speeding up in the same week is a very odd way for a bubble to burst, whatever the headlines say. What split the stocks, in our reading, was cash, and there was nothing subtle about it. Alphabet produced minus $9.1bn of free cash flow in the quarter, bought back nothing, and covered the hole with $29bn of new debt and $12.4bn of stock sold into the market. Meta (META) produced minus $2.1bn, bought back nothing, and this week put a stock sale plan of about $97.5bn on the table. Amazon's free cash flow over 12 months has sunk to minus $42.4bn. Microsoft, at the other end of the room, produced plus $18.6bn and spent $4.4bn of it buying back its own stock. Alphabet then had its worst day since it listed in 2004 and Microsoft slipped half a percent on the week .. same demand, different payer, and whatever else was going on inside each of them, that is the line we read the market as having drawn. Pull back to the whole market and the equal weight S&P added 0.8% on the week, 9 of 11 sector ETFs rose, health care closed at its highest in our data, and for October as a whole the equal weight made +4.95% against -0.93% for the index. The money hasn't left, it has moved out of the AI heavyweights and into everything else, and the latest leg of that journey ran on cash. An index can fall while the average stock inside it rises, October did exactly that, and anyone reading the headline number on its own is missing half the picture.
Having said all of that, the sellers may yet be wrong. The spending IS turning into revenue, see the cloud numbers above, and Alphabet's capex came in UNDER what the street expected, about $3.7bn under, which is not the behaviour of a company that has lost control of its cheque book. Microsoft's capex came in under too, albeit their CFO put it down to deliveries slipping, so we don't file the two in the same drawer. Alphabet's CFO also put part of the cash shortfall down to TPU systems built and sat in inventory ahead of the sale being booked, and inventory is cash in waiting, it comes back when the sale lands. If that cash does come back then Thursday's sellers of Alphabet are wrong, and the stock they sold is the cheap one. Worth noting too that the move into health care is now steep, the health care ETF (XLV) is +13.7% since the end of July against the chip ETF (SMH) at -3.3%, and in our view a rotation that steep is more often nearer its end than its start, so we hold the rotation view with that caveat pinned to it.
What does this mean? For the retirement core, on its own, nothing. The rule reads one number, the month end close, and that number gets its proper airing in YOUR MONEY. The core's long bond leg had an equally sleepy week, the fear plus inflation case we laid out last Sunday went precisely nowhere, the 10yr breakeven (the inflation the bond market is pricing over the next 10 years) sat at 2.34% on both Fridays and the 5yr eased 2bps from 2.48% to 2.46%, which is about as dull as a bond market gets.
For stocks there are still 2 roads and they are the same 2 as last week, only steeper. Road one, the spenders show the cash coming back, inventory turns into sales, capex peaks, and the index closes the gap on the average stock. Road two, more quarters of negative free cash flow and more paper issued (Meta's plan, Alphabet's at the market sales) and the biggest weights in the index keep lagging while the rest of the market quietly gets on with it. Either way the index can move without the average stock following, so whatever the headline does this month, know what's sitting on top of it.
Oil, a touch higher. January Brent went 111.70 to 113.43, about 1.5%, and the December contract expired on Friday at 117.64, which is why we quote January and why the oil price on your screen will look as though it dropped $4 over the weekend .. it did no such thing, the front month rolled and that is the whole story. US crude on the December contract added 0.8% to 104.12. Iran served up its weekly mix of talks and strike options, every bit of it reported and not one bit confirmed, CNN's unnamed officials placing any order after the midterms. We note it and move on, nothing is confirmed and oil did less than $2 in 5 sessions.
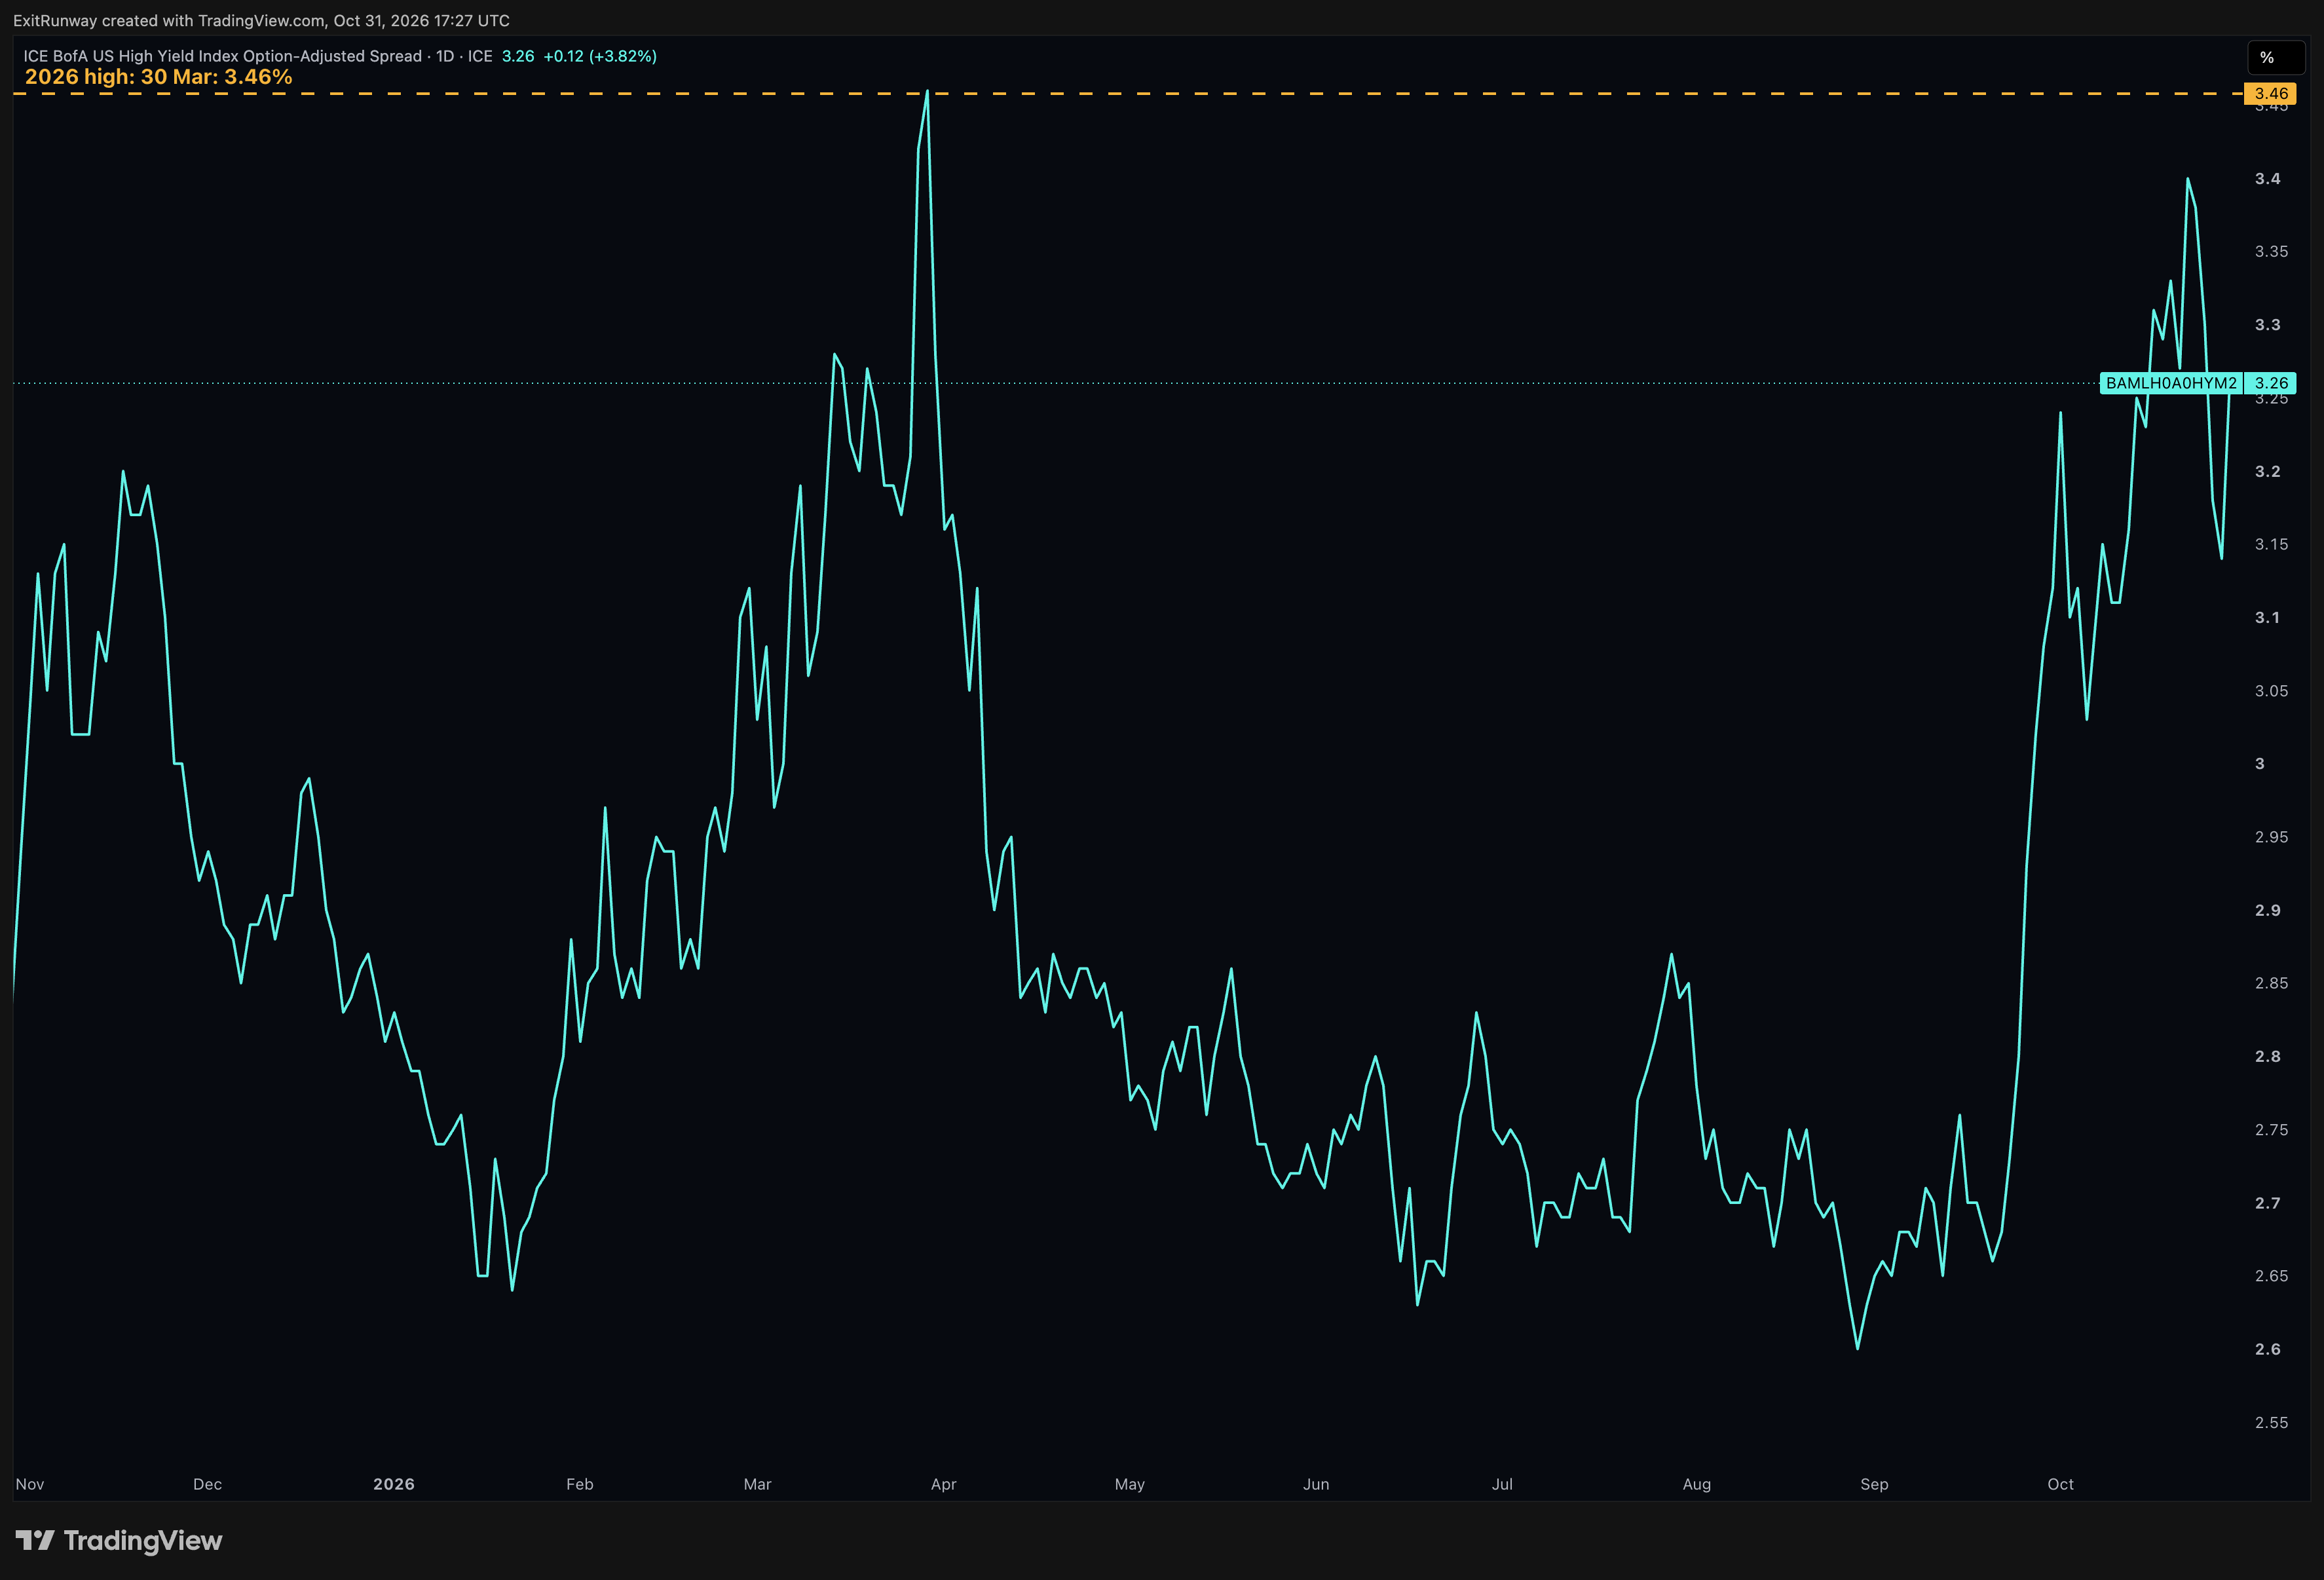
Bonds and borrowing next. 6bps off the 10yr, 5.00% to 4.94%, and 13bps off the 2yr, 4.69% to 4.56%. The 30yr mortgage on Freddie Mac's survey came down 8bps to 7.24% from 7.32%, the first survey week to catch the 22nd October rally, so a household finally got a crumb of it. Junk borrowers got rather more than a crumb .. their spread fell 24bps from 3.38% on Friday 23rd to 3.14% on Wednesday, the lowest since 9th October, then backed up 12bps to 3.26% on Thursday, which still leaves it 12bps below where the week started. The investment grade spread (what the solid balance sheets pay over treasuries) went 0.91% to 0.89%, 2bps, which is to say nothing. So the broad credit market got MORE relaxed in the very week the AI borrowers were being sorted through, and the bottom line is that credit as a whole isn't stressed and, in our reading, the AI corner of it is. We say "in our reading" there deliberately, because there is no spread we hold that prices that corner on its own, the nearest thing to it is the neocloud share prices in THE AI TRADE, where you will also find the small matter of a $63bn chip financing for Anthropic going around the junk market altogether, backed by Broadcom's balance sheet.
Two scenarios then, and they hang on one word, inflation. Headline PCE is running 3.6% YoY against core at 3.1%, and the half point between them is food and energy, core being the measure that strips both out. Core isn't the comfort it sounds like either, it ticked UP to 3.1% from 3.0%, and the food and energy push hasn't been one way traffic, across Q3 as a whole it pulled headline UNDER core (2.1% against 2.5% annualised) and then in September alone it shoved the other way, headline +0.5% on the month against core +0.3%. The FED held at 3.75-4.00% on Wednesday by 10 votes to 2, the 2 dissenters (Cook and Hammack) wanting a hike, and the statement said inflation remains elevated, didn't say where from, and offered no guidance in either direction, which is a committee saying as much as it can while saying nothing at all. The market has a December hike at roughly 4 in 5. Pay isn't the culprit, Friday's employment cost index rose 0.8% on the quarter and 3.4% over 12 months with wages at 3.1%, the exact pace of core prices. So the picture is a sticky core, 3.1% and up a tenth, and a headline that food and energy shove around month to month, and in the latest month the shove was up.
Which is why, for the second issue running, oil is the swing factor in our reading. Core's YoY rate moved a tenth in a month, wages move once a quarter, oil moves every day, so the energy slice of inflation moves fastest and in our reading it is the one we expect to move the December odds first. Friday's jobs number can move them too, as can October's CPI on the 10th, and jobs has its row in the table below. 4 in 5 is a long way from a done deal, it can become 9 in 10 or fall to a coin toss on not very much, and of the 3 movers oil is the one we watch first.
A box on its own, as it answers the obvious question, why hasn't a 5% 10yr broken anything yet?? US nominal GDP (the current dollar number, before inflation is taken out) grew at a 5.6% annualised pace in Q3 and the 10yr pays 4.94%. When an economy grows faster than the rate its government borrows at, the debt has a chance to shrink relative to income, other things being equal (a large enough deficit can outrun it), and where that holds it is a support to earnings and equities even at a yield that looks ugly on paper. Here the gap is about two thirds of a point, which is thin, it's one quarter's data and it's annualised, so it is a cushion and not a promise, but it is the right way round, and for as long as it stays that way a 5% 10yr is something this economy can carry.
The week's data, a line and a verdict apiece. FED on hold at 3.75-4.00%, 10-2, Cook and Hammack for a hike .. priced, the 2 dissents are the news. Q3 GDP +3.4% annualised after inflation, +5.6% before it, first estimate .. strong, revised 25th November. September PCE +3.6% YoY, core 3.1% from 3.0% .. sticky. Employment costs +0.8% on the quarter, 3.4% YoY .. steady, no wage push. Alphabet -12.3%, worst day since the 2004 listing .. cash, not demand. Microsoft -0.5% on the week .. cash positive, held. Amazon cloud +39%, stock -3.1% on the week .. growth is not cash. Intel (INTC) guided December to $15-16bn and 25c against the 52c it had only just printed for September, -28.6% on Friday .. a shocker. SK hynix (000660) a record quarter and about 100 trillion won back to shareholders in 2026, +10.9% on the day .. bought. Oracle (ORCL) a target of at least $30bn of free cash flow in its 2029 financial year, +14.6% to Wednesday then most of it handed back, +3.6% on the week .. bought, then doubted. Broadcom (AVGO) backing a $63bn vehicle to buy its chips and lease them to Anthropic .. the strong lending a balance sheet to the weak. 30yr mortgage 7.24% .. relief, at last reaching a kitchen table.
The week ahead in US Eastern time, and watch the clocks, the US went back an hour on Sunday 1st November so Eastern now sits 5 hours behind UTC. Three rows carry the move the options market is pricing, meaning the at the money straddle at Friday's close read through to the first expiry after each report, Wednesday 4th for AMD and Friday 6th for Palantir and Qualcomm, so it covers every session up to that expiry and not the print alone (Palantir's window takes in midterm day), and to be crystal clear it is a SIZE and not a direction, how far the market thinks the stock travels by then, not which way.
| Day | What | Why it matters |
|---|---|---|
| Mon 2nd Nov | Apple (AAPL) results after the close, call at 5:00 pm | The last of this round of giants, and the one whose cash is still positive |
| Mon 2nd Nov | Palantir (PLTR) results after the close, webcast at 5:00 pm | Options market pricing a move of about 13.3% either way by Friday 6th, the largest of the three implied moves below |
| Tue 3rd Nov | US midterm elections | All eyes on them. The reported timing of any Iran decision was after the midterms, and oil is the swing factor |
| Tue 3rd Nov | AMD results after the close, call at 5:00 pm | Options market pricing about 8.9% either way by Wednesday 4th; the chips closed under their 200d on Friday, so this print lands with the group already for sale |
| Wed 4th Nov | Qualcomm (QCOM) results after the close | Options market pricing about 9.9% either way by Friday 6th |
| Fri 6th Nov | October jobs report, 8:30 am | With oil, the other thing that can move the December odds, with a hike priced at about 4 in 5 |
Further ahead.
| Day | What | Why it matters |
|---|---|---|
| Wed 25th Nov | Q3 GDP, second estimate | The 3.4% is an advance number and moves |
So, Apple (AAPL) and Palantir (PLTR) on Monday night, the vote and AMD on Tuesday, Qualcomm (QCOM) on Wednesday, jobs on Friday, and a December hike priced at 4 in 5 sat over the whole lot. Oil gets watched first because in our reading it's the piece of inflation that can move before December, and the junk spread second because it tells us whether the AI corner stays a corner or starts to spread. The rest is company by company, which is where this week's story lived anyway.
The average stock beat the indexthe average stock beat the index
The box first, as this is the issue it changes in. Our retirement core rule reads a month end close and only a month end close, and October's came in on Friday at 7,580.07, 0.93% under the end of September at 7,651.54 and under the momentum line as we published it in issue 2 on 9th October, about 7,633, a line that moves with the index. On the data the momentum half of the rule has turned to caution, and issue 2 was clear on what that means by itself, a watch and no more. The rule acts only when the long term trend turns with it, again on a month end close, and that line sat well below the index the last time we drew it, so the allocation stays where it is and the watch goes up. We spell that out because an index fund holder reading October's headlines could be forgiven for thinking something had broken. Nothing did. The index sits 3.05% under its record close of 6th October, which is a pullback near the highs plus a month end that landed under a line we had already drawn.
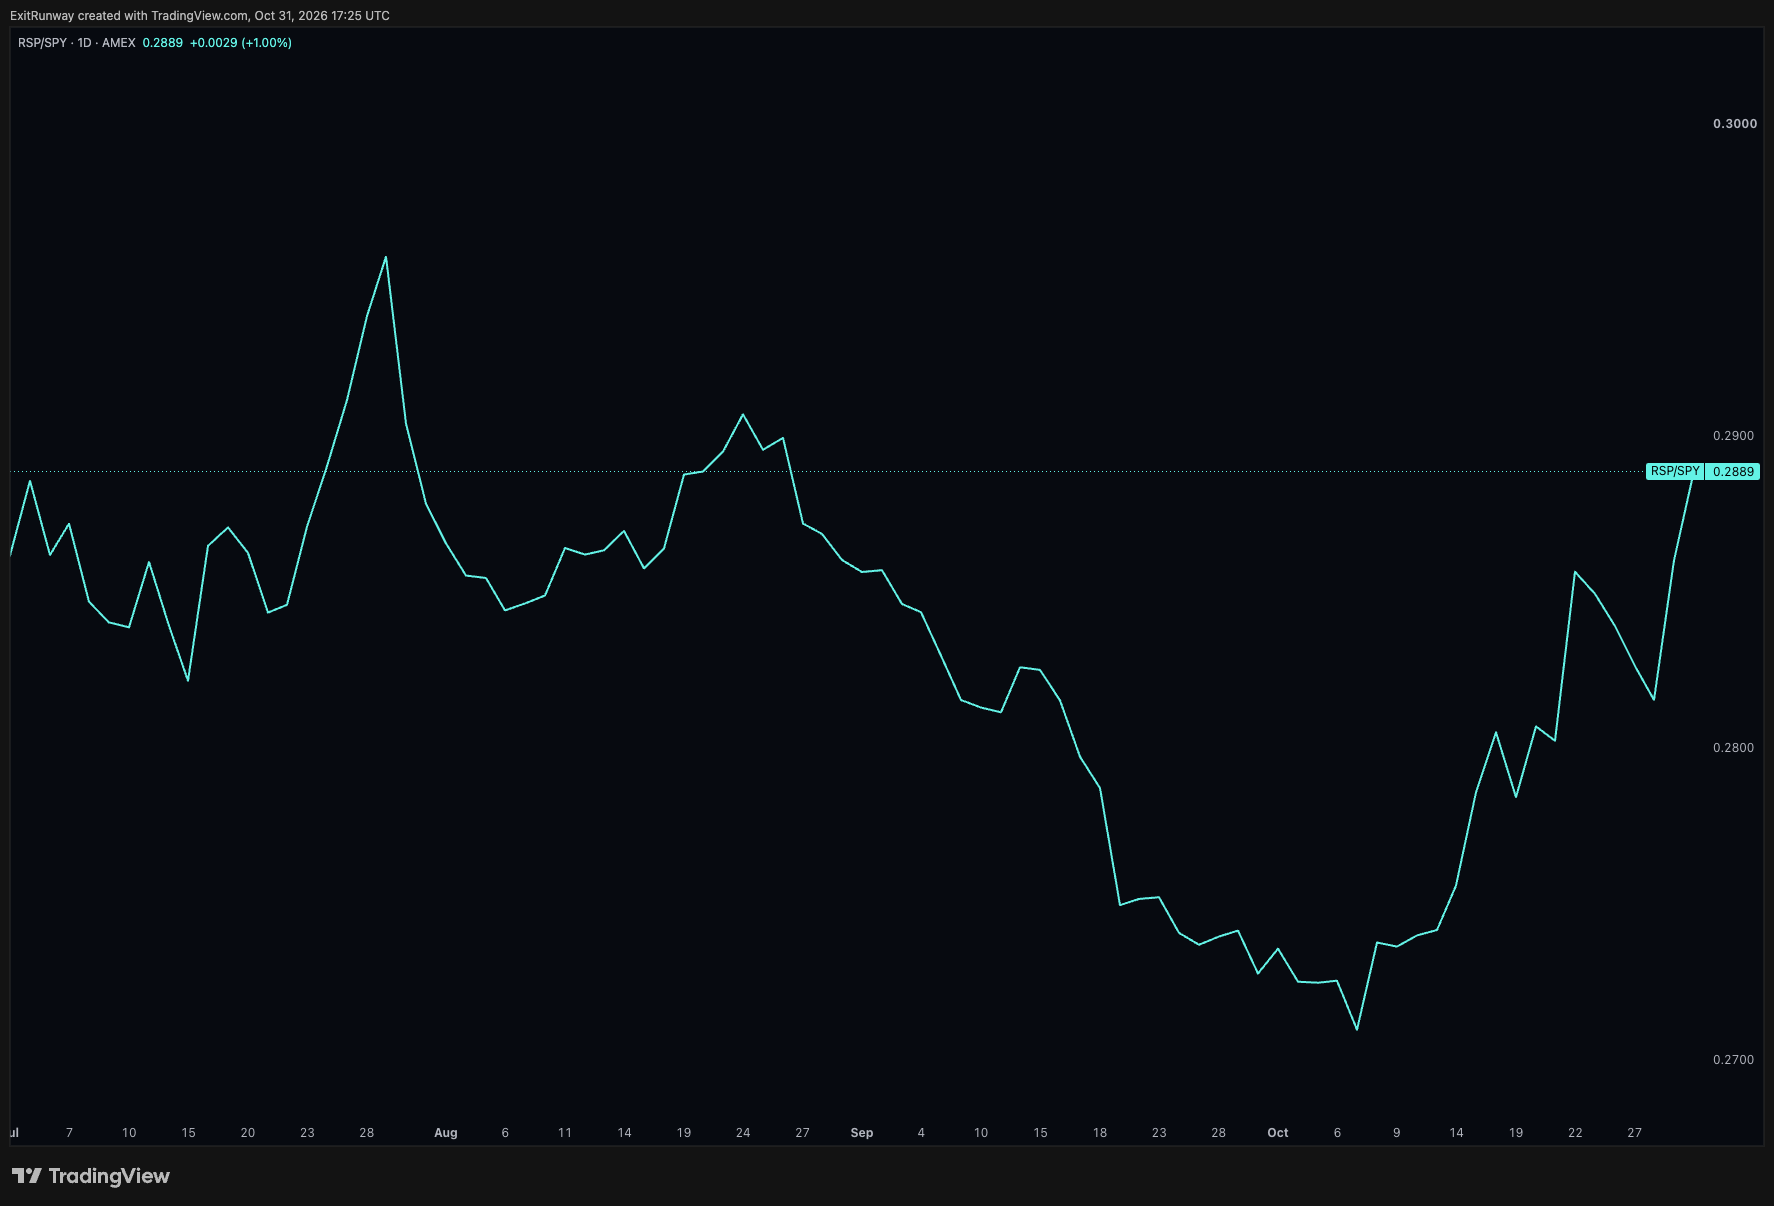
Now to the part of October that matters more than the headline. From the end of September to the end of October the S&P 500 lost 0.93% while the equal weighted version (RSP) of the SAME 500 companies, every name counting the same, gained 4.95%, a gap of 5.88 points in a single month, call it 6. The Nasdaq-100 ETF (QQQ) was down 6.66%, the chip ETF (SMH) down 14.21%, the health care ETF (XLV) up 9.77%. Among the giants at the top of an index fund Alphabet (GOOG) lost 18.3% in October, Meta (META) 15.2%, Nvidia (NVDA) 10.4% and Amazon (AMZN) 3.5% .. Microsoft (MSFT) gained 1.8% and Apple (AAPL) 3.5%. The week was October in miniature, equal weight +0.82%, the index ETF (SPY) -0.56%, 9 of 11 sector ETFs up, communications (XLC) -5.32% the worst of them because that is where Alphabet and Meta live, technology -2.03% the only other faller, and on the other side health care +3.12%, materials (XLB) +2.79% and staples (XLP) +1.31%.
Where did the money go?? Into the defensive sectors, the same answer we have given for a month now, and October's close only underlined it. Energy (XLE) topped the month at +13.85%, no surprise given the oil story in THE MACRO, and right behind it the defensives, staples +10.94%, utilities (XLU) +10.12%, health care +9.77% and at its highest close in our data on Friday with Eli Lilly (LLY) +11.3% on the week. 9 of the 11 sector ETFs rose in October, only technology (-8.30%) and communications (-9.98%) fell, and the index ETF fell regardless. In our view that picture changes only when 3 things line up at once, oil comes down, inflation pressure eases and credit eases with it, which is what hands duration a tailwind (duration being the stocks and bonds whose value sits furthest out in the future, so they move the most when rates move). Until then the defensive bid stays put and the names that need a lower rate to rally don't get their lower rate. It's the view we run our own trading book on and it turns up again in THE AI TRADE.
What does this mean? Picture 2 funds that own the same 500 companies. One owns them by size, so the biggest count for the most, and that is the one almost everybody has, the other owns them in equal amounts. In October the second beat the first by about 6 points and there wasn't a single company in one that wasn't in the other. The ONLY difference was the weights, and the heaviest of them sat on the AI names that fell, Alphabet 18.3%, Meta 15.2%, Nvidia 10.4%, Amazon 3.5%, with Microsoft and Apple the exceptions that rose. 3 of those 4 fallers have negative free cash flow, Nvidia does not and fell regardless, so the cash sorting is this week's reading and not the cause of October's gap, let's be precise about that. None of it is a reason to switch funds, it's a reason to know what you own, because at the top an S&P 500 index fund is a bet on a handful of companies and the AI build out they are paying for, and in a month when the market marks that bet down the fund lags the average stock without a single thing inside it being broken.
The core's long bond leg had the quiet week THE MACRO described, the 10yr breakeven was flat at 2.34% so the inflation half of the case against long bonds went nowhere, and the fund itself crept up a little on the week. Nothing to do there. On the household side the 30yr mortgage eased to 7.24%, the first survey week to catch the 22nd October bond rally, small, and the second weekly fall in a row, 16bps from 7.40% to 7.24% across 2 weeks, so a lower long rate is at long last reaching a kitchen table.
So the core holds its allocation with a watch on it, and what to take from October is that the average stock had a perfectly decent month while the index had a poor one. An index fund owns the market by size, size this year means AI, and that is how an index can have a poor month while the average stock inside it has a good one.
Who pays from their own cashwho pays from their own cash
12 months ago the question was whether the demand for AI compute was real. Last week it became who pays for the build out, and this week the market gave its answer with unusual clarity .. it will pay for demand, it will pay for spending, but it wants that spending covered from the company's own cash, so the one that covered it held and the ones that didn't were sold, hard in Alphabet (GOOG)'s case and modestly in Amazon (AMZN)'s. All 4 of them sit on one sheet below.
The spenders
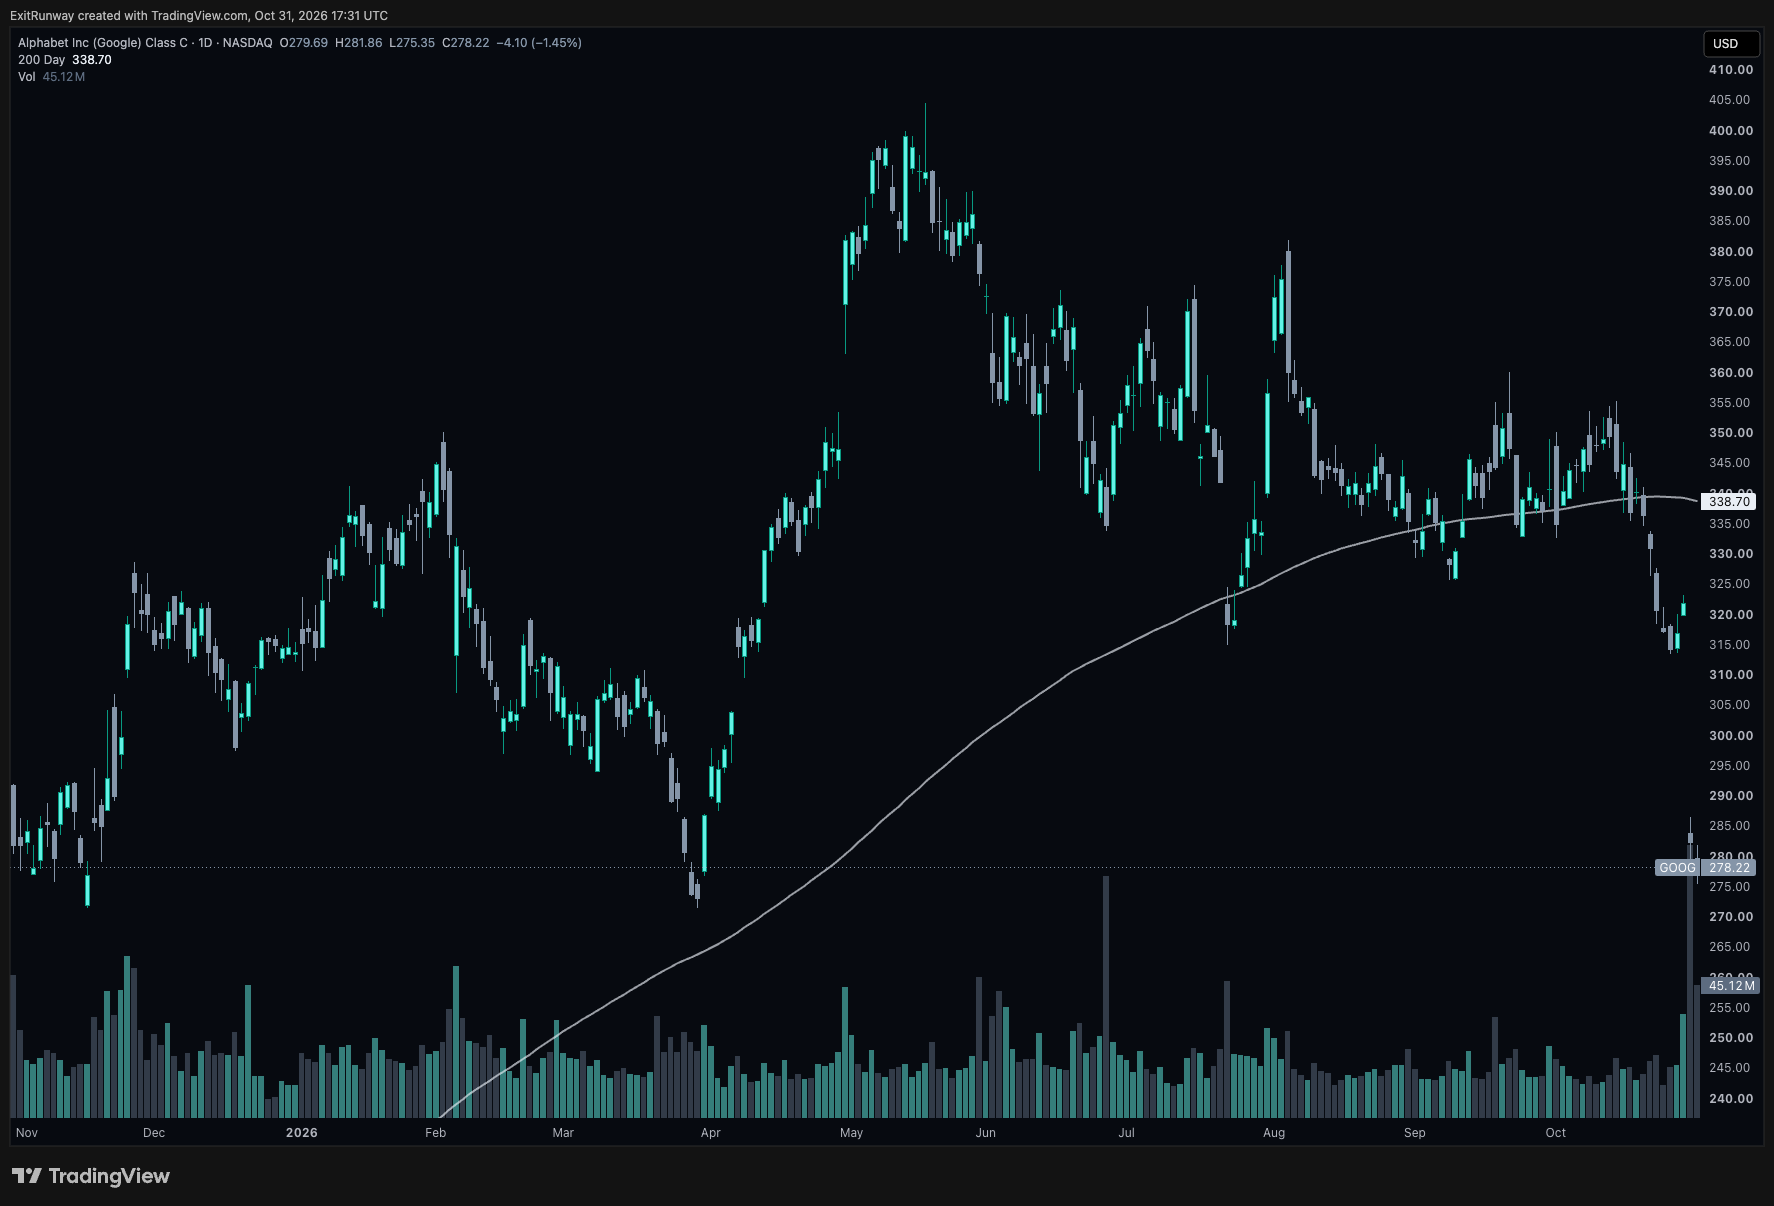
Alphabet first, as it took the hardest marking and because we own it. Capex was $51.4bn for the quarter, more than double a year ago and, note this, about $3.7bn UNDER what the street had pencilled in, so this was NOT an overspend. The damage was on the other side of the ledger, operating cash flow fell 12.6% YoY to $42.3bn and left minus $9.1bn of free cash flow after the spending, the second negative quarter in a row, buybacks at zero, and the gap filled with $29.0bn of new debt and $12.4bn of stock sold into the market during the quarter. The 2026 capex plan stayed at $195-205bn and the CFO said 2027 would go up significantly. Demand was fine, search grew 12% against 16.8% the quarter before (we say slowed and leave the why alone, because the why is disputed) and cloud grew 103%. The stock lost 12.29% on Thursday, its worst day since it listed in 2004, then another 1.45% on Friday to 278.22, -12.31% on the week, 17.9% under its 200d at 338.70 and 30.3% under its record close of 13th May. Thursday alone took about $490bn off the market value.
Microsoft (MSFT) is the control group. Azure grew 48% from 43%. Capex including leases was $45.2bn against about $50.7bn expected, and the CFO was explicit that the gap was third party capacity deliveries slipping, with more than $50bn guided for next quarter, so on the CFO's own words this is a delay and not a cut, and anyone calling it discipline is quoting a press release that doesn't exist. Free cash flow came in at $18.6bn, down 27% but a LONG way from negative, and $4.4bn of it went on buying back their own shares. The stock rose 1.07% to Thursday, lost 1.55% on Friday and closed the week -0.50%, which is flat in a week the neighbour dropped 12%. For context it had run 54% from its June low to its 13th October high, so there was no shortage of profit to take had the market been in the mood to take it.
Meta (META) reported last week rather than this one, and issue 4 carried the number that mattered, free cash flow of minus $2.12bn, with the same release showing zero buybacks and a $9.89bn legal charge. What's new this week is how they plan to plug the hole .. a stock sale plan of about $97.5bn all in, upsized, being $25.0bn of common stock at $625 a share (up from $22.5bn) plus $12.5bn of mandatory convertible preferred, both closing on 29th October, and about $60bn more to be sold into the market from 2027. Nvidia (NVDA), AMD and Broadcom (AVGO) indicated non binding interest in up to $5bn of it between them, so what exists today is a plan and the cash is still to be raised. The stock lost 4.30% on the week and 15.2% over October. The legal charge and the search slowdown at Alphabet are competing explanations for each stock's fall and we won't pretend to untangle them. What we can say is simpler, the market sold the names whose cash went negative, whatever else was going on inside each of them.
Amazon closed out the set on Thursday night, AWS revenue $46.0bn, +39% from 37% the quarter before, operating income $28.1bn, and purchases of property and equipment of $77.3bn in the quarter, 2.2x a year ago, which dragged 12 month free cash flow to minus $42.4bn from plus $14.8bn a year earlier. The 2026 cash capex plan of about $220bn was reaffirmed in the same breath. The stock lost 1.41% on Friday to 240.35, -3.08% on the week, and sits 1.3% under its 200d at 243.40, which quite frankly is a polite response to a company that has just reaffirmed about $220bn of spending for this year while already $42bn in the hole over the last 12 months. THE LESSON below is built on exactly that pair, cloud +39% and cash from plus $14.8bn to minus $42.4bn inside 12 months.
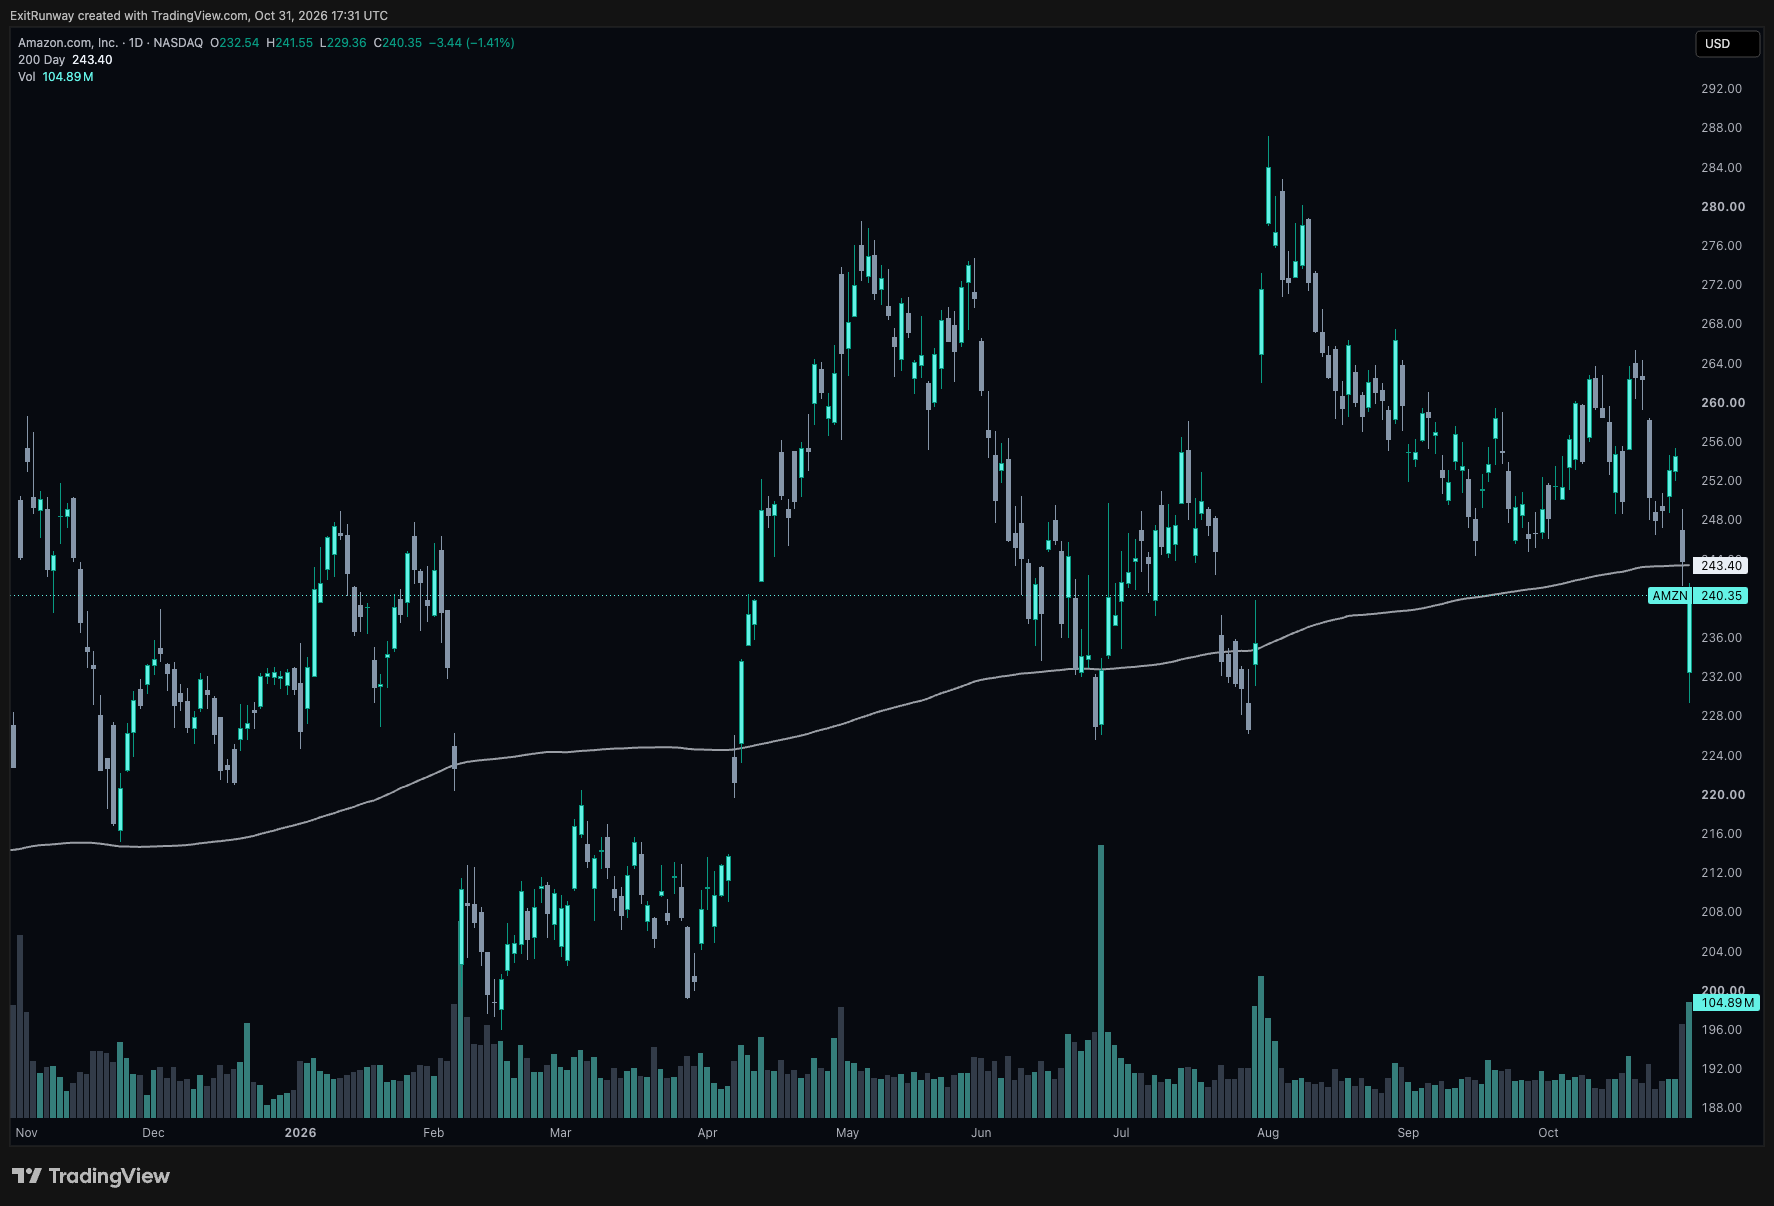
Line the 4 up. The 3 whose own cash no longer covers the spending were sold, the one that still pays from cash and buys back its shares barely moved, and the demand story was identical in every case (3 cloud businesses accelerating at once), so what got priced was the payer. That's the sheet the market is marking to now and it's a better sheet than last week's, when it sold Meta for spending more and Tesla (TSLA) for spending less, which told you it was nervous, whereas this week it sold the names whose cash went negative, a number that sits in the cash flow statement, which tells you it has actually started reading. The exception is Oracle (ORCL), who were paid for a dated promise of cash they haven't produced yet, and most of that was handed back inside the week.
Our book, and the test we set ourselves. Issue 4 set the bar, Alphabet closes back above its 200d, about $339, and back inside the channel on our weekly chart by Friday 30th, or the line gets closed. Friday closed at 278.22, 17.9% under the 200d. The test failed, no two ways about it, and it goes in the book as failed. We did not close the line. We are holding it. The forward view, ours and conditional. We may add to Alphabet, and to positions more generally, IF the macro lines up, and lining up means oil comes down and the AI trade, tech, the higher beta names and duration get a bid. The midterms are next week with all eyes on them, more earnings are still to come, markets may well pull back or chop through all of it, and for as long as oil stays up tech won't rally, in our view. So the line is held, any add waits on that condition, and it's written here so a reader can mark us on it. One more thing, and it sits apart from oil .. lower oil does nothing whatsoever for Alphabet's cash. Minus $9.1bn of free cash flow and zero buybacks are the company's own numbers and only the company's next set can change them. Any change to the line goes in the book channel after its fill, never before.
SEMIS
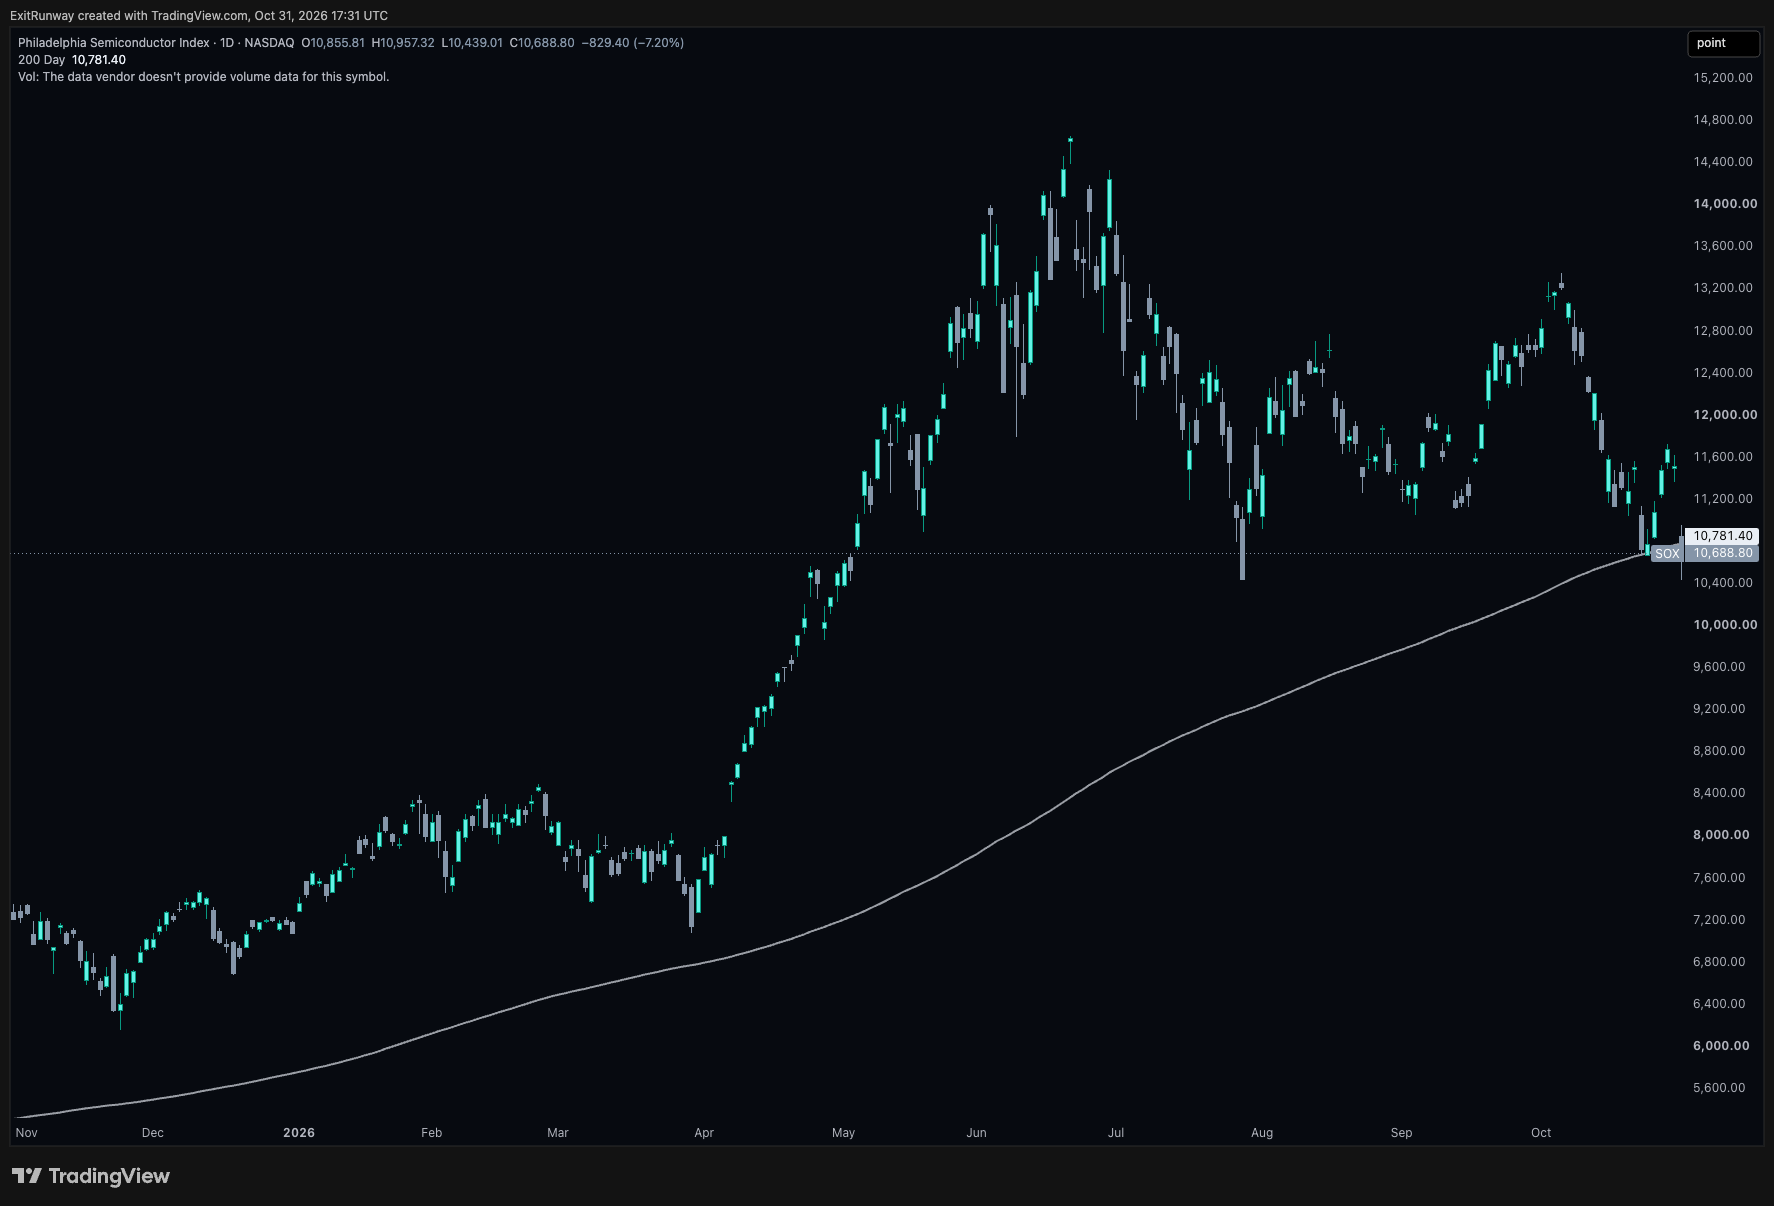
The chips told a completely different story from the spenders right up until Friday, when they told the whole of it in one session. The SOX put on 6.85% from Monday to Thursday, 10,779 to 11,518, in a week that saw Alphabet and Meta sold, Alphabet's fall coming on the Thursday. Our reading of the week as a whole, and it is a separate point, is that the chips get paid either way while the spending lasts and the spenders carry the bill, so a week in which the spenders reaffirm $220bn and $195-205bn of capex (Amazon's came Thursday night, after the close) is a good week for the people selling them the kit, whatever it does to the spenders themselves. We leave the Monday to Thursday rise itself unexplained. Then Intel (INTC) guided, and the index fell 7.20% on Friday to 10,688.80, -0.84% on the week and 0.9% under its 200d at 10,781.40. One close under the line by less than a percent is a break and nothing worse than that for now, but the chips carry the beta, and Friday was a reminder that beta cuts both ways inside a single session.
SK hynix (000660) printed the cleanest result of the week, revenue 104.6 trillion won, operating profit 83.3 trillion, a margin of about 80% (!!), about 100 trillion won going back to shareholders in 2026 including the 40 trillion announced in August, and long term contracts covering more than half of their 2027 and 2028 production capacity, capacity being the word, not revenue. The shares added 10.89% on Wednesday 28th. Bought, and that is where we leave the cause, Samsung rose sharply the same day without the same payout and we've been caught on that one before.
Intel is the other end of the spectrum. Q3 revenue $16.5bn +21% and 52c on the adjusted measure, then a Q4 guide of $15.0-16.0bn and 25c, miles under the 52c they had only just printed, with the CFO saying the PC slowdown runs at least through the first half of next year. We haven't verified what the street was expecting so we measure the guide against Intel's own last quarter, and on that measure it is a shock. The stock lost 28.58% on Friday to 65.76, -24.38% over the week and -45.3% over October. A stock priced as a recovery story doesn't get to guide like that and keep the price.
Sandisk (SNDK) is the memory version of the Amazon lesson in miniature. Revenue $11.03bn in the September quarter, +378% YoY and +23% on the quarter, an 85.0% gross margin, $5.0bn of buybacks, an 8 for 1 split from 20th November and next quarter guided to $12.2-12.6bn, a record on every single line. The stock dropped 5.3% on Thursday and another 13.47% on Friday to 1,150.89, -7.04% over the week and -33.85% over October. We don't know Friday's cause and we won't invent one. What we do know is that a company can print the best numbers in its history and get sold the same afternoon, which tells you the price had already banked all of it before the print.
Data centres and neoclouds
The financing moved up a tier this week. A $63bn special purpose vehicle will buy Broadcom chips and lease them to Anthropic, with Bank of America, Citi and Morgan Stanley arranging the first lien, Blackstone the second, and Broadcom providing residual value support equal to the first lien amount, which in plain English means the chip seller stands behind the resale value of its own chips so that a lender will lend to the chip buyer. Our reading is that the strong are now lending their balance sheets to the borrowers the junk market prices hardest, which tells you how badly the build out needs funding, and for now, again in our reading, it is a reason the broad junk spread can fall while the AI corner stays expensive, because that corner is being financed AROUND the junk market rather than through it. Anthropic filed publicly to list on Monday 26th under the ticker ANT with first half revenue of $16.3bn, and that is all we have to say on it for now.
Oracle laid out the destination in its own financial years, which end in May .. at least $30bn of free cash flow in FY29, turning positive from the second half of FY28 (that half starts December 2027), capex peaking across FY27 and FY28 and stepping down thereafter. It is a target, and the market bought it on Wednesday, +14.6% on the week to that point, then sold most of it back on Thursday and Friday to finish +3.57%. A company telling you when the cash arrives is useful, a company telling you the full amount arrives in the year to May 2029 is asking for patience, and Thursday and Friday showed precisely how much of that this market has in it.
The neoclouds, the borrowers who build the data centres and rent the compute out, did the round trip with the chips. IREN, CoreWeave (CRWV) and Nebius (NBIS) were up 5% to 12% by Thursday, down 8.8% to 10.4% on Friday, and finished the week -3.83%, +1.17% and -2.90%, which leaves them 68.7%, 60.2% and 46.2% under their 52 week closing highs. A bounce inside a drawdown of that size is a trade and nothing more, and we treat it as one.
Priced for more growth than it deliveredpriced for more growth than it delivered
Short, as the news is narrow and the lesson is the one THE AI TRADE already carries. ServiceNow (NOW) fell 26.95% on Thursday and 33.87% on the week to 105.12, Fortinet (FTNT) fell 20.09% on Thursday and 24.40% on the week to 136.08, and the software ETF (IGV) lost 5.70% on the week and is still +10.3% since the end of July. The guidance is what got sold, in our reading, and it was hardly dramatic .. ServiceNow guided its contracted backlog for the next 12 months to grow 18.5% in Q4 from 20.5% in Q3 while RAISING its full year subscription guide, and Fortinet trimmed its full year service revenue guide to $5.150-5.170bn from $5.180-5.220bn with service revenue +13% in the quarter. A 2 point slowdown in a backlog guide and a $30-50mn trim took a third and a quarter off 2 stocks, which is what a price that assumes more growth does the instant it gets less. Microsoft (MSFT) sits in the same ETF and slipped half a percent, because it delivered the number its price assumed and the other 2 did not.
Free cash flow, the money left after the spendingfree cash flow, the money left after the spending
Amazon (AMZN) grew its cloud 39%, quicker than last quarter's 37%, a pace the company itself had called its fastest in 18 quarters, and the stock lost 3.08% on the week. A modest fall and we won't dress it up, because the lesson doesn't rest on the size of the drop, it rests on the table underneath it, and Alphabet (GOOG) at -12.3% on the week is the dramatic version of the very same thing. Here it is in the companies' own numbers.
| Company and period | Cash the business brought in (operating cash flow) | Spent on buildings and chips (capex) | Free cash flow | Shares bought back |
|---|---|---|---|---|
| Alphabet (GOOG), July to September | $42.3bn | $51.4bn | minus $9.1bn | $0 |
| Microsoft (MSFT), July to September | $58.0bn | $39.4bn in cash ($45.2bn with leases) | plus $18.6bn | $4.4bn |
| Amazon (AMZN), twelve months to September | $168.3bn | about $210.7bn net | minus $42.4bn | none |
Free cash flow is the cash a business brings in from what it sells, less what it spends on the buildings, chips and kit it needs to keep going and to grow, and what's left over is the number. A household runs the same sum, salary in, mortgage and the building works out, and whatever remains is what you get to save or hand back. Spend more than comes in and there are only 2 options, borrow or sell part of the house, and Alphabet did BOTH in a single quarter, $29bn of debt and $12.4bn of stock. That is what minus $9.1bn means in practice, whatever one thinks of the spending.
Here's the bit that catches people out. Revenue growing 39% and cash going negative are the same decision seen from 2 sides. Amazon brought in $168bn of cash from operations over 12 months, +29%, and spent about $211bn on property and equipment, and the second number grew faster than the first, which is precisely where the cash went. Microsoft (MSFT) spent $39bn in cash in a quarter, $45bn counting leases, and still had $18.6bn left over, so what the market marked was not the spending, it was whether the spending is covered.
What none of this tells you is whether the spending will pay off. Negative free cash flow in a build out is a timing question, and Alphabet's CFO put part of the quarter's gap down to TPU systems built and sat in inventory before the sale is booked, which is cash waiting to come home. The test is whether it does, and the only evidence that counts is next quarter's table.
The saver's question is the one YOUR MONEY left hanging. The heavyweights in your index fund are paying for their growth, so the question is from whose pocket .. their own cash, and the growth is yours too, new debt, and a lender has a claim on it before you do, new shares, and your slice of it just got smaller.
The free community
Leave your email and your Discord invite is in the confirmation email we send you straight away. The Weekly follows every Sunday.
Send my invite »