- Our read: oil fell 13%, bond yields fell for the healthy reason and the jobs report was strong, and the stock market had its worst day since April 2025 anyway. When every macro box gets ticked and stocks still break, the cause is who owns the stocks and what they were forced to sell, and that is what Thursday looked like
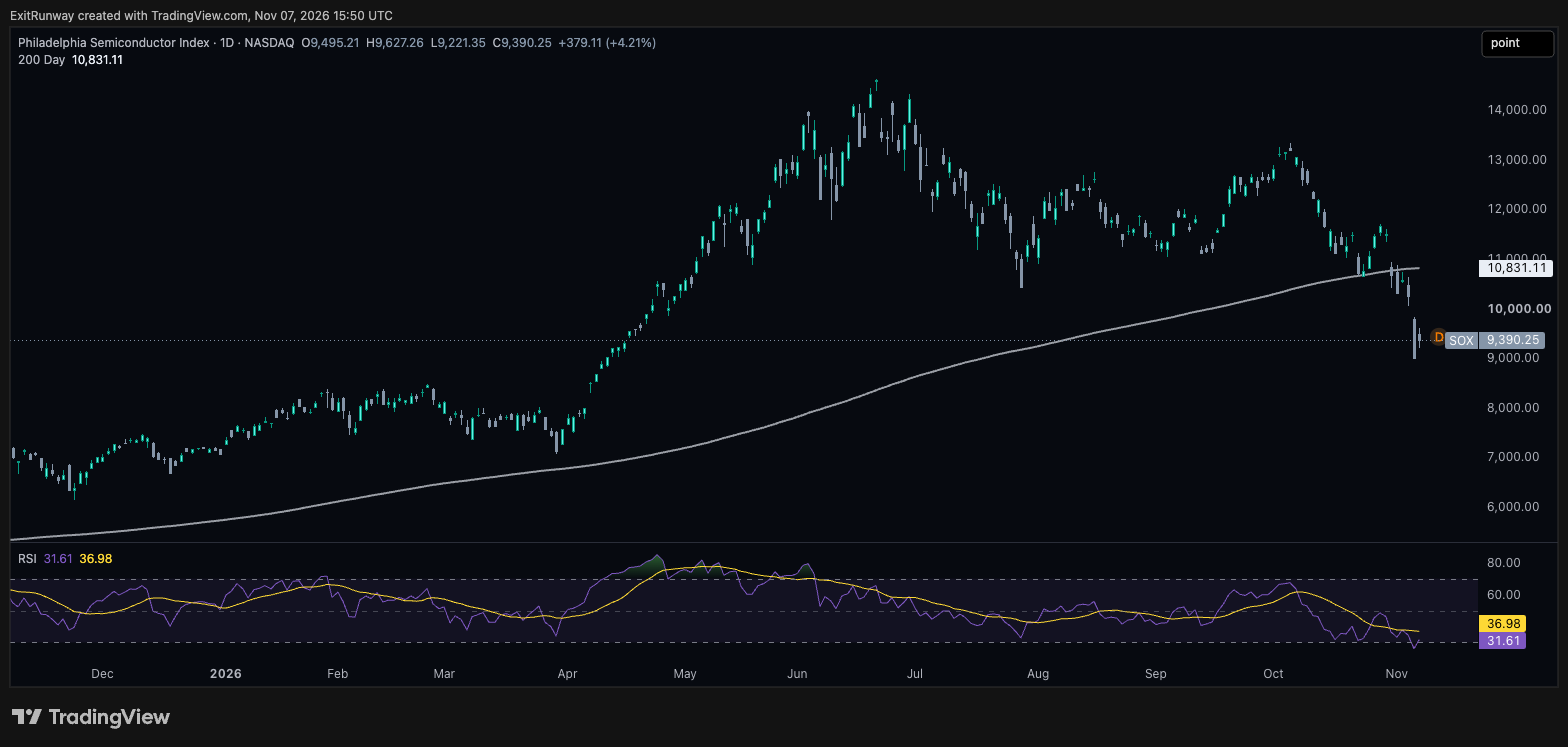
- The one number: 12.2%. That is how far the chip index fell on Thursday alone, the biggest one day fall in our data, which starts in January 2025. The standard S&P 500 fund lost 2.7% on the week and the average stock inside it lost 1.0%
- The one date: Tuesday 10th November. The October CPI lands at 8:30 am Eastern and the $42bn 10 year auction follows at 1:00 pm Eastern. Thursday's closing lows are the line to watch all week
- Also inside: why last week's cash story did not repeat this week, a chip index that is now 35.8% under its June high, and a lesson on what a washout is and what it isn't
The macro did its joboil and bonds behaved, the stocks didn't
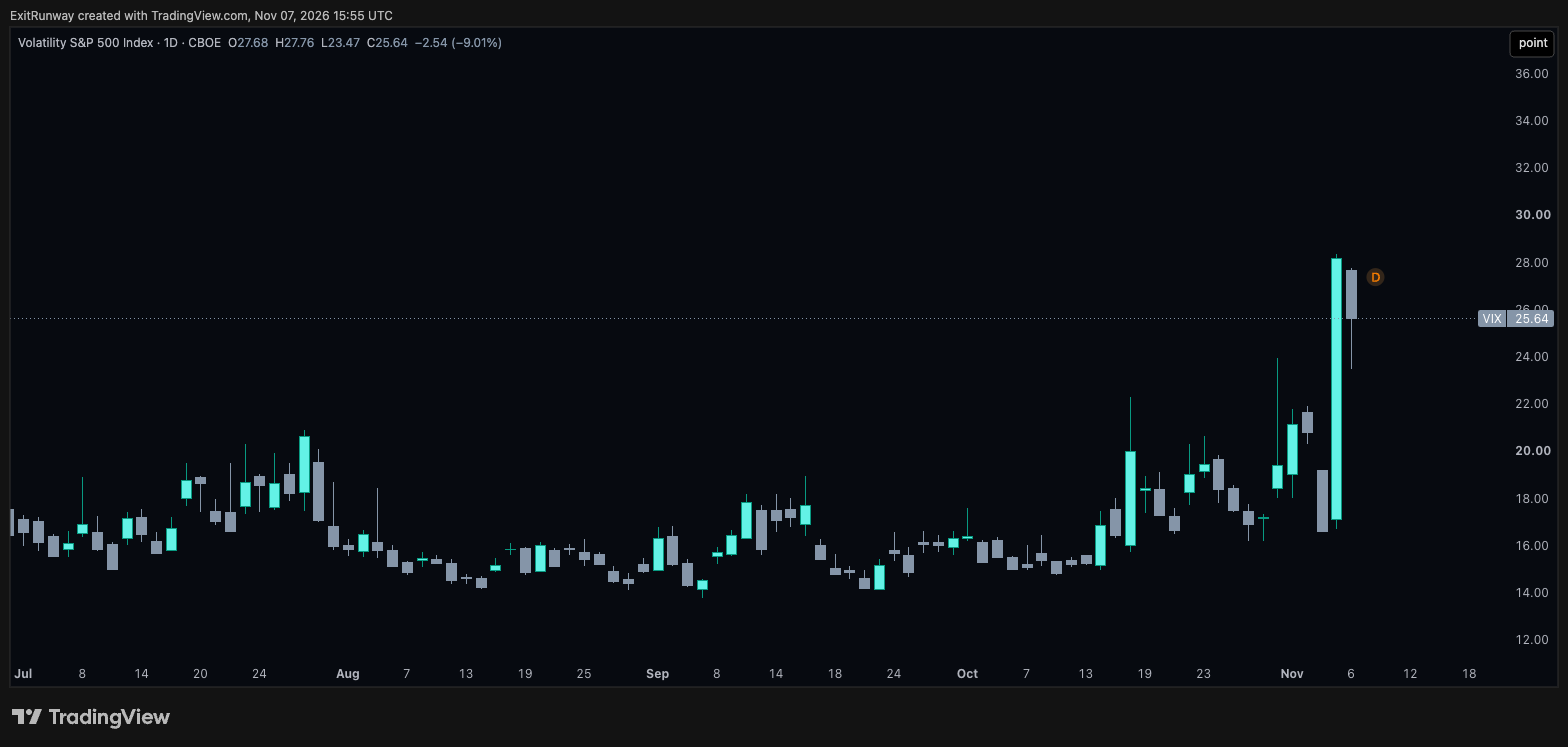
What a strange week to write about, because the macro screens did EVERYTHING they were supposed to do and the market did the opposite. Oil fell 13%, US crude from 104.12 to 90.83 and January Brent from 113.43 to 98.32, under $100 at Friday's close, which is exactly the relief this market has been begging for. The bond market played along, the 10yr went from 4.94 to 4.86 and the 2yr from 4.56 to 4.51, and look under the hood because that is where it gets interesting .. the 10yr breakeven (the inflation the bond market is pricing over the next 10 years) dropped 11bps to 2.23 while the real yield (what a 10yr pays after inflation) went UP 3bps to 2.63. Yields are falling because inflation fears are falling and not because everyone is running for safety, the good kind of fall, the kind that is supposed to be rocket fuel for stocks. Instead the S&P 500 lost 2.68%, the Nasdaq 100 lost 4.91%, the SOX (the chip index) lost 12.15% and the VIX went from 19.42 to 25.64. So much for the textbook!
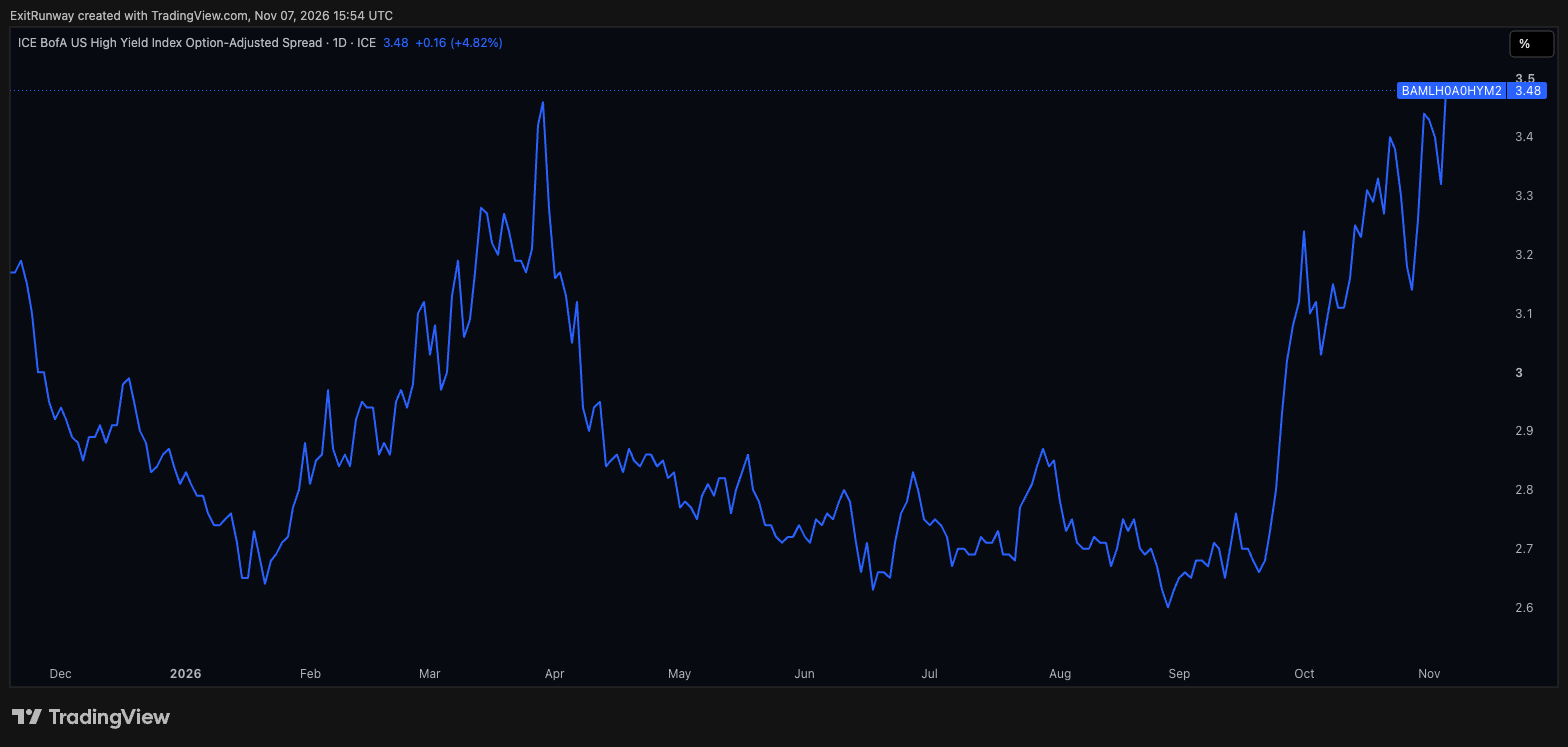
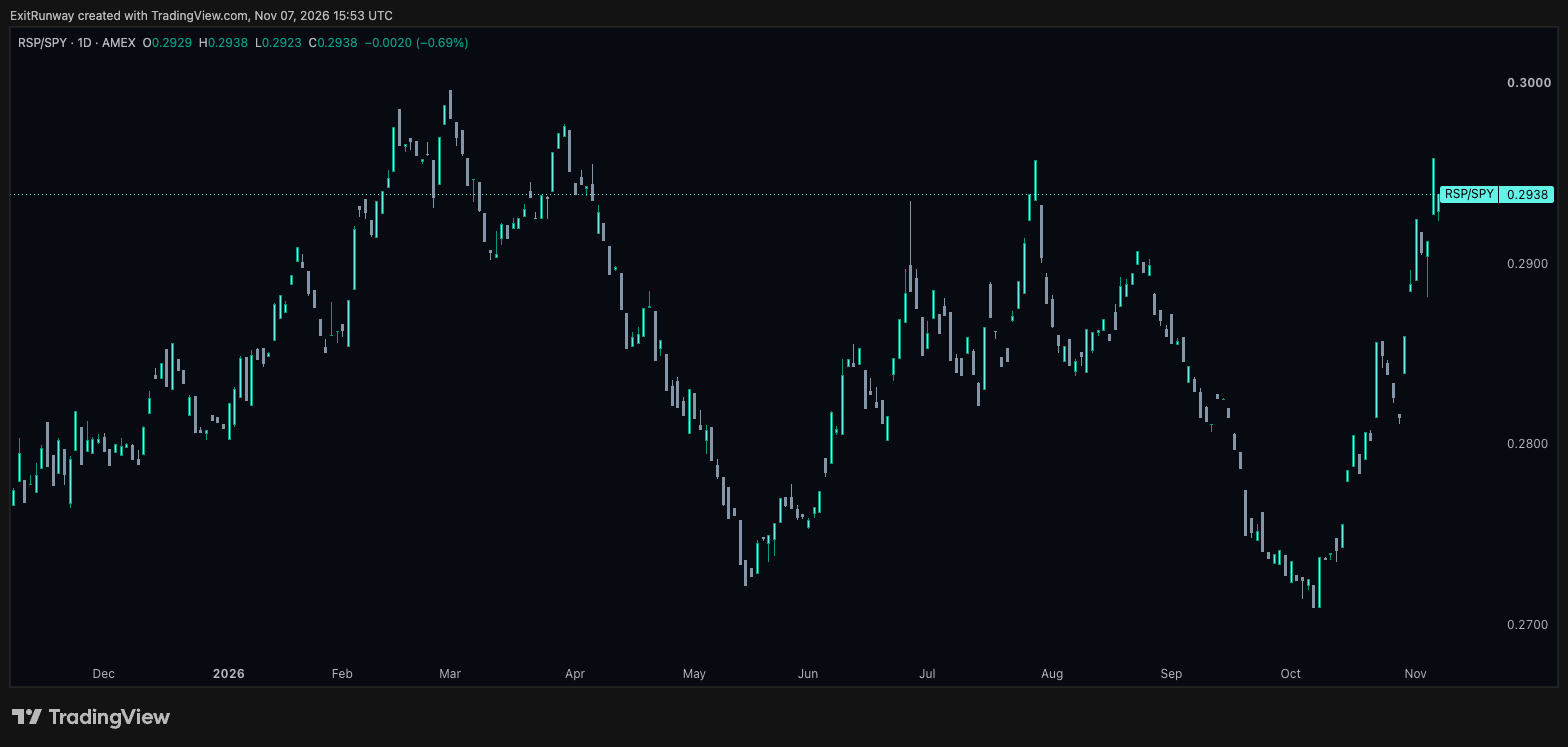
Thursday is the whole week. Wednesday went to plan, the market took the midterms as the clearing event and the S&P 500 ripped 1.6%, and then on Thursday the floor fell out. The S&P 500 fell 4.4%, its worst day since April 2025, the Nasdaq 100 fell 6.4%, the SOX fell 12.2% and the VIX jumped 69.7% to 28.18, and in our price data (which only goes back to January 2025) the Nasdaq 100, SOX and VIX moves are the biggest of their kind, and going back to 1990 the VIX jump is the third biggest. As of Saturday we could find no single company result or data release during Thursday's session that explains it, and we would rather say that than invent a headline. What DID happen was Tuesday. Democrats are projected to take the House and the Senate and Democrat Gina Hinojosa beat Greg Abbott for the Texas governorship, the first Democratic governor of Texas since 1995, and Texas is home to some of the biggest of the new AI data centre builds, IREN's Childress and Sweetwater sites among them. Slower permits, a bigger power bill for the builders .. a LONG way from law, but a trade this crowded doesn't need a law, it needs an excuse. Check credit on a day like this, because stocks falling and businesses failing are two different stories. The junk spread (the extra yield junk borrowers pay over treasuries) widened 16bps on Thursday to 3.48, the highest in our 2026 data, but it was 2.60 in August so nothing has broken, and the average stock (the equal weight fund (RSP)) lost 1.04% on the week against 2.70% for the standard S&P 500 fund (SPY). That looks like forced selling to us, funds being made to cut risk whether they like the price or not, which can be violent and brief and can also be the first leg of something nastier, and nobody on earth knows which.
Friday's jobs report was 165,000 against forecasts of about 60,000 to 70,000 depending on which survey you read, unemployment 4.1%, and August and September revised UP by 53,000 and 31,000, so the 3 month average is 137,000, well above the 12 month average of 48,000 and not a labour market that needs the Fed's help. The 2yr jumped 5bps to 4.51 and the S&P 500 added 0.3%, and the market now prices a December rate hike (the Fed meets on 8th and 9th December) at over 78%, up from nearly 67% the day before according to CME's FedWatch, though other reports put it a few points either side. The big point is that the AI trade is no longer on oil's leash. For 2 months the story was lower oil, lower inflation, lower rates, high flyers back up, and this week gave us the first 3 links of that chain and the chips fell 12% anyway. Next week is about whether Thursday's closing lows hold .. 7,353.73 on the S&P 500, 26,629.81 on the Nasdaq 100 and 9,011.14 on the SOX, which Friday closed above. If they hold then Thursday was the washout, and if the SOX closes under 9,011 it wasn't. The CPI is Tuesday at 8:30 am Eastern, with $58bn of 3 year, $42bn of 10 year and $25bn of 30 year auctions on Monday, Tuesday and Thursday at 1:00 pm Eastern, plus whatever the new Democratic majority says about data centres, Anthropic's listing (talked about for the middle of the month, no confirmed date) and Iran, where oil fell on hopes of talks with nothing confirmed.
The index and the average stockthe index fund fell 2.7%, the average stock 1.0%
If one thing in your life is an S&P 500 index fund, this was a week of 2.7% off the value, and the most useful thing to understand about that number is what is NOT in it. The equal weight version of the same 500 companies (RSP), where the smallest company counts the same as the biggest, fell 1.04%, and on Wednesday it closed at its highest in our data, which starts in January 2025. Same 500 companies, 1.7 points apart, and the ONLY difference between the 2 funds is how much each company counts. The standard fund counts size, so what you were really holding this week was the biggest companies in the index, the AI names that fell hardest on Thursday, and the technology fund (XLK) shows it, down 8.2% against 0.04% for health care (XLV).
| Sector fund, Fri 30th Oct close to Fri 6th Nov close | Change |
|---|---|
| Energy (XLE) | -12.0% |
| Technology (XLK) | -8.2% |
| Industrials (XLI) | -2.8% |
| Materials (XLB) | -1.5% |
| Utilities (XLU) | -0.7% |
| Health care (XLV) | -0.04% |
| Consumer staples (XLP) | +0.7% |
| Financials (XLF) | +1.2% |
| Consumer discretionary (XLY) | +1.9% |
| Real estate (XLRE) | +1.9% |
| Communication services (XLC) | +4.9% |
Reading it: energy fell with oil and technology fell with the chips, and the rest of the market, 5 of the 11 sectors, went UP in the same week the index lost 2.7%.
Now put the headlines in their place, because the biggest number you saw this week was not your fund. The S&P 500 closed Friday 5.65% under its record close of 6th October, the Nasdaq 100 is 13.6% under its high of the same day, and the chip index (the SOX) is 35.8% under its June high. Those are 3 very different amounts of pain, and a 12% headline is almost always about the narrowest and most violent of them. On the borrowing side the news is better. The average 30 year mortgage rate, from Freddie Mac, was 7.18% on Thursday 5th November, down from 7.24% a week earlier, 7.32% the week before that and 7.40% on 15th October, 3 falls in a row, and the 10yr yield falling 8bps this week is the kind of move that tends to show up there. It is a reason to know what you own, because at the top an S&P 500 index fund is a bet on a handful of enormous companies and the AI build out they are paying for, and in a week when the market marks that bet down, the fund lags the average stock without a single thing inside it being broken.
Same companies, 2 different dayssame companies, 2 different days
The spenders
Last Sunday the story was who pays for the AI build out from their own cash, and the market sold the ones that don't. This week the same companies had 2 completely different days in the space of 24 hours, which tells you what kind of week it was. On Wednesday the market took the midterms as the clearing event and money poured back into the biggest names. Microsoft (MSFT) rose 6.7%, Amazon (AMZN) 6.1%, Apple (AAPL) 5.3%, Alphabet (GOOG) 3.2% and Meta (META) 1.4%, and Nvidia (NVDA) fell 3.2%. Look at that Apple number, because Apple reported a record September quarter on Monday night and fell 1.9% the next day, then rose 5.3% 2 days later with no news of its own, on a day Microsoft and Amazon did the same. That is a basket move, institutions moving money from one place to another and not caring much about the price, not a verdict on any one company. Then Thursday arrived and the same names went the other way, Microsoft -3.6%, Meta -4.0%, Amazon -2.2%, Alphabet -1.9% and Apple -1.5%, with Nvidia the casualty at -9.3%.
On the week it came out like this, and it is not what last week's lesson would have predicted.
| Week, Fri 30th Oct close to Fri 6th Nov close | Change |
|---|---|
| Amazon (AMZN) | +7.9% |
| Alphabet (GOOG) | +2.1% |
| Microsoft (MSFT) | +1.7% |
| Apple (AAPL) | -0.7% |
| Meta (META) | -0.8% |
| Nvidia (NVDA) | -8.8% |
Reading it: Amazon, the third hardest sold last week, rose most, Alphabet, the hardest sold, rose only 2.1%, Meta slipped again, and the supplier, Nvidia, fell 8.8%. There is no neat pattern, which is the point: one week's story is not a rule.
SEMIS
The chip index (SOX) fell 12.15% on the week, and the shape of it matters more than the total. Monday -3.4%, Tuesday +2.6%, Wednesday -3.1%, then Thursday -12.2% and Friday +4.2%. Friday gave back 30% of Thursday's loss, which is a bounce and not a recovery. The index is now 35.8% under its 22nd June high and 13.3% under its 200 day average, a line stocks that have run far above it tend to come back down to, and this one has come through it. The damage is worst where the crowd was biggest. Micron (MU) fell 22.0% and is 43.1% under its June high, SanDisk (SNDK) fell 27.4% and is 64.2% under its June high, Intel (INTC) fell 14.4% and is 60.1% under its June high, Broadcom (AVGO) fell 9.9% and Nvidia fell 8.8%, and the Korea fund (EWY), which is in large part a bet on memory chips, fell 10.4%. Notice who fell least. Nvidia lost less than the index over the week, and it is no longer a pure chip story, it is a huge spender and an investor in other companies too, but a 9.3% fall on Thursday says that does not make it immune. These are crowded, cyclical names with a lot of leveraged holders, and when the whole group is for sale quality only shows up in HOW MUCH it falls and not in WHETHER.
Data centres and neoclouds
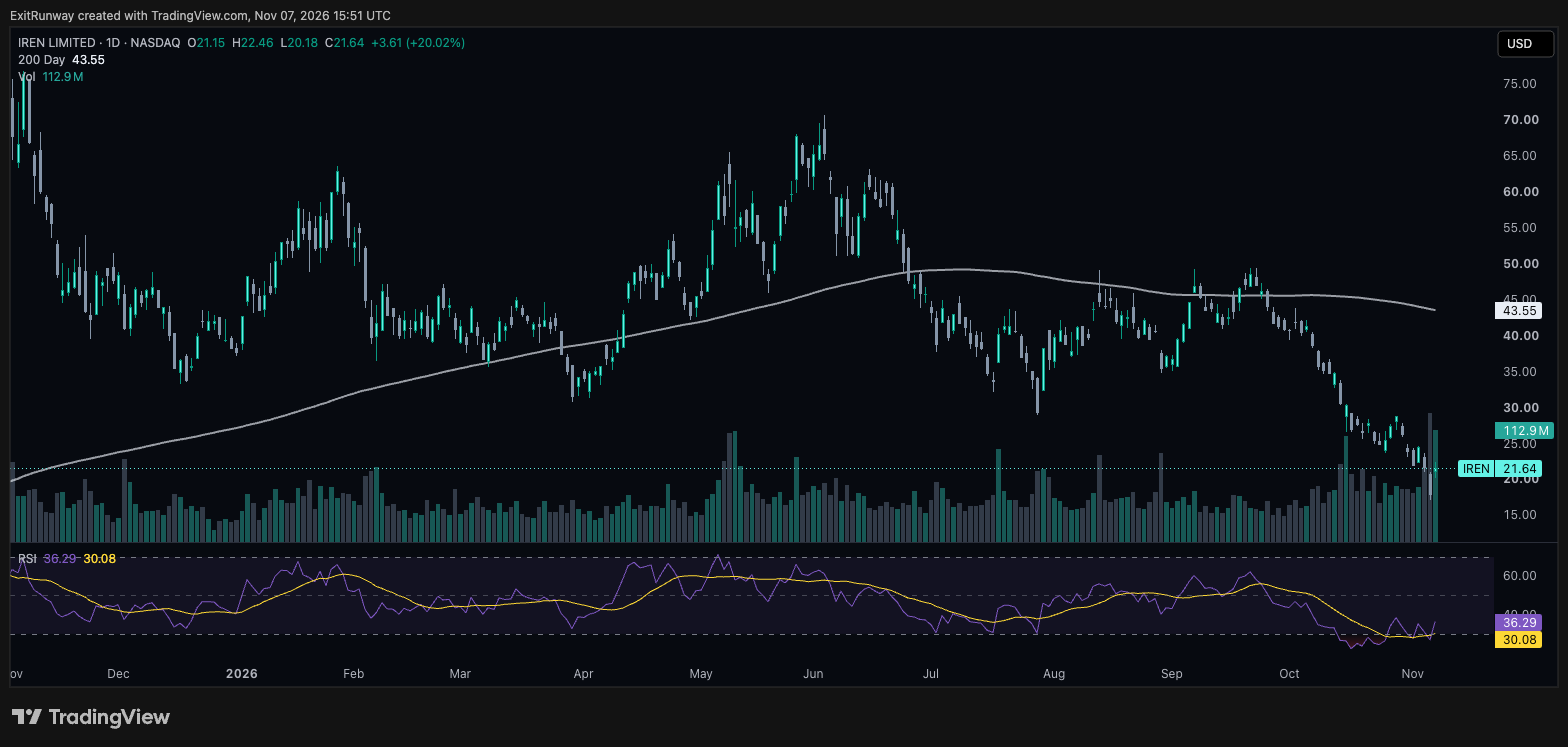
This is where the borrowing is, and it is where the junk spread matters most. CoreWeave (CRWV) fell 15.4% on the week, Nebius (NBIS) 16.0%, IREN (IREN) 9.7% and Oracle (ORCL) 11.2%, and they are 66.4%, 54.8%, 68.1% and 53.2% under their 52 week highs. The best evidence for the Texas reading is Wednesday, the first session after the result, when the S&P 500 rose 1.6% and IREN fell 11.2%, CoreWeave 9.9% and Nebius 6.7%. IREN builds in Texas, and its stock then fell 17.0% on Thursday before it reported and rose 20.0% on Friday after revenue came in 66% above the previous quarter, which is the kind of swing a very crowded, very leveraged stock makes in a market with a lot of forced sellers. Oracle's week also carried its own filing on 2nd November to raise $10bn in stock and $10bn in bonds, and the stock fell 8.8% on Monday and rose 5.8% on Tuesday, which tells you how little the market knew what to do with it. The point that matters: these companies borrow, so a junk spread at its highest in our 2026 data is a direct cost to the junk rated ones among them, CoreWeave for one, whether or not their customers pay. The sellers could still be wrong about the businesses. They are not wrong about the borrowing.
Software got sold with the rest, the software fund (IGV) down 5.2% on the week and CrowdStrike (CRWD) down 13.4%, with the company reported by the Wall Street Journal to be paying about $495m for 2 AI security start-ups. We have nothing to add there beyond the move, and it is one line, not a section.
What a washout iswhat a washout is, and what it isn't
You will hear the word washout a lot this week, so here is what it means and what it doesn't. A washout is a day, or a few, when people who were forced to sell are selling together, without caring about the price. There are 3 kinds of forced seller. There are leveraged investors who borrowed to own the stocks and get a margin call (a demand from the lender to put in more money or sell), funds that hit a risk limit and have to cut, and the rules based funds that automatically sell when volatility jumps. None of them is selling because they have changed their mind about the company, they are selling because a rule or a lender says so. That is why a washout looks the way Thursday looked, with the fear gauge up 69.7% in one session to 28.18, the biggest jump since at least January 2025, and a market that falls 4.4% with no single new fact we could find.
The reason it matters is that forced selling ends, and an actual change in the business doesn't. When the sellers run out the price can bounce hard, and Friday's 4.2% in the chips was a small taste of that. But a bounce is not a floor, and there are 3 questions that tell you whether it was a washout or the start of something else. Did credit seize up (the junk spread widened 16bps on Thursday to 3.48, the highest in our 2026 data, but it was 2.60 in August, so it moved and did not break)? Did the average stock fall as much as the index (it fell far less)? And did anything change in what the companies are actually earning (not on Thursday)? Those answers point to forced selling, and none of the 3 is a guarantee. If the junk spread keeps climbing next week, or the closing lows of Thursday (7,353.73 for the S&P 500, 26,629.81 for the Nasdaq 100, 9,011.14 for the SOX) give way, then it was not a washout, it was the first leg. Bloomberg reported that several big multi-strategy hedge funds lost money in October, Millennium and Marshall Wace among them, while others gained, and a month like that is the kind of environment forced selling grows in. The lesson to take is not to catch the exact bottom, nobody does that. It is to know which kind of fall you are looking at before you decide what it means for you.
The free community
Leave your email and your Discord invite is in the confirmation email we send you straight away. The Weekly follows every Sunday.
Send my invite »