- Our read: stocks shrugged off Tuesday's inflation report in a day, and the bond market spent the whole week pricing it. Of the 10-year's 29 basis point rise, 28 was real yield, which says the market thinks the Fed has more to do, not that fear of inflation is spreading
- The one number: 5.15%. That is where the 10-year Treasury yield finished the week, the biggest weekly rise of 2026
- The one date: Tuesday 17th November. Nvidia reports at around 4:20 pm Eastern with an interim CEO in place, and Anthropic's own filing says it expects to price its IPO on Wednesday 18th
- Also inside: an S&P 500 fund that rose 2.6% in the week its second-biggest holding fell 12.8%, and a lesson on why a cheap cyclical is a warning and not a bargain
Stocks forgot it, bonds did notStocks gave the inflation number a day, the bond market gave it all week
It was one of those weeks where the stock market and the bond market were handed the same piece of information and walked away with opposite conclusions. On Tuesday morning the October inflation report (CPI) showed core prices, which is everything except food and energy, up 0.3% for the third month in a row. That doesn't sound like much, but three months at that pace works out to about 3.7% a year and the FED is aiming for 2%. The S&P 500 fell 0.38% on the day, had it all back by Wednesday's close and finished the week up 2.51%, nearly all of which was banked on Monday before the number even came out. As far as stocks were concerned inflation was a one day story.
The bond market didn't see it that way at all. The 10yr Treasury yield is the rate the US government pays to borrow for ten years, and it's the number that mortgages and pretty much every other long-term rate take their cue from. It finished the week at 5.15%, up 29 basis points (a basis point is a hundredth of a percentage point), which is the biggest weekly rise of 2026. And it wasn't one panicky session on Tuesday that then faded, more of the rise came after Tuesday's close than before it.
So what exactly is the bond market worried about? This is where it's worth looking under the hood, because a yield is really two things added together. One part is the inflation investors expect over the next ten years, the other is what they earn on top of that inflation, which is called the real yield. Of the 29 basis points, 28 were real yield and 1 was expected inflation. In other words the market's guess for inflation over the next decade barely moved. This is NOT a market panicking that prices are running away. It's a market saying the FED has more work to do, that rates will have to go higher to get inflation back down, and it has repriced the cost of money accordingly.
Compare that with the week before, when yields fell and they fell for the healthy reason, expected inflation dropped 11 basis points as the market relaxed a little about prices. This week is the mirror image, rates up and nearly all of it coming from the FED side of the ledger. Why does the reason matter if the number on the screen is the same? Because the real yield is what you get paid, after inflation, for lending to the US government and taking no risk at all. Every share in the market is competing with that. When it goes up the bar goes up with it, and it goes up most for the companies whose profits are years away.
To be fair to the stock market it does have a case. The lows from early November held, the forced selling of the week before has calmed down and the fear gauge fell by about a quarter. But the two verdicts can't both be right for very long, and it's worth remembering which way the plumbing runs. Stocks are valued off the rate the bond market sets, the bond market isn't valued off stocks. So either yields come back down and the bounce was right, or they stay up here and the stock market has to go back and deal with a number it thought it had finished with.
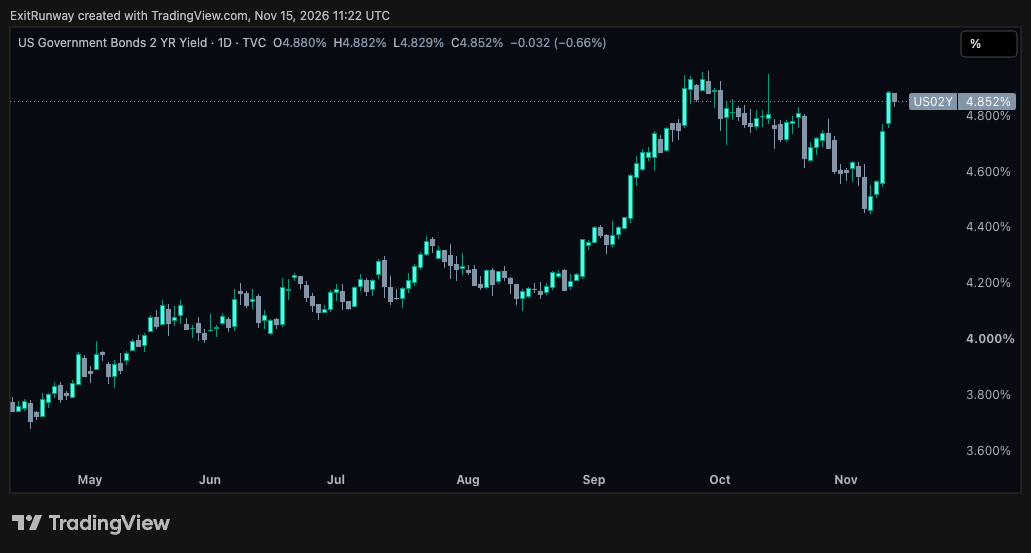
What tells you which one it's going to be? The 2yr, far more than the index. The 2yr yield is the part of the bond market that moves most directly on what the FED is expected to do next, and it rose 37 basis points to 4.88%, more than the 10yr and within touching distance of this year's high of 4.92%. The FED meets on the 8th and 9th of December and the next CPI report only lands the morning after they decide, so they go in without it. If the 2yr pushes through that high between now and then, the bond market is doubling down. If it starts to back off, the shrug from stocks was the right call after all.
The fund, and what is inside itThe fund rose 2.6% while its second-biggest holding fell 12.8%
Suppose somebody had told you last Friday that the boss of Nvidia (NVDA) would be gone within the week and the stock would lose 12.75%. What would you have guessed for your S&P 500 fund? A bad week, presumably, and for a perfectly sensible reason. Nvidia is the second-biggest holding in the index, so a fund that tracks it (SPY) puts about $6 of every $100 you hand over into that one company. The fund finished the week UP 2.59%.
So how does a fund shrug off a hit like that? Start with how it's built. An index fund doesn't own 500 companies in equal slices, it owns them by size, which means the biggest companies get the biggest share of your money. That normally gets talked about as a risk, and it is one, but this week showed the other side of it. The only holding bigger than Nvidia is Apple (AAPL), at just under $8 of every $100, and Apple rose 4.06% to its highest close in our data, which goes back to January 2025. The two giants at the top of the fund went in opposite directions by about 17 points. Apple didn't cancel Nvidia out, the Nvidia hole was the bigger of the two, but it took a good chunk of the sting away and left the rest of the market to settle the week.
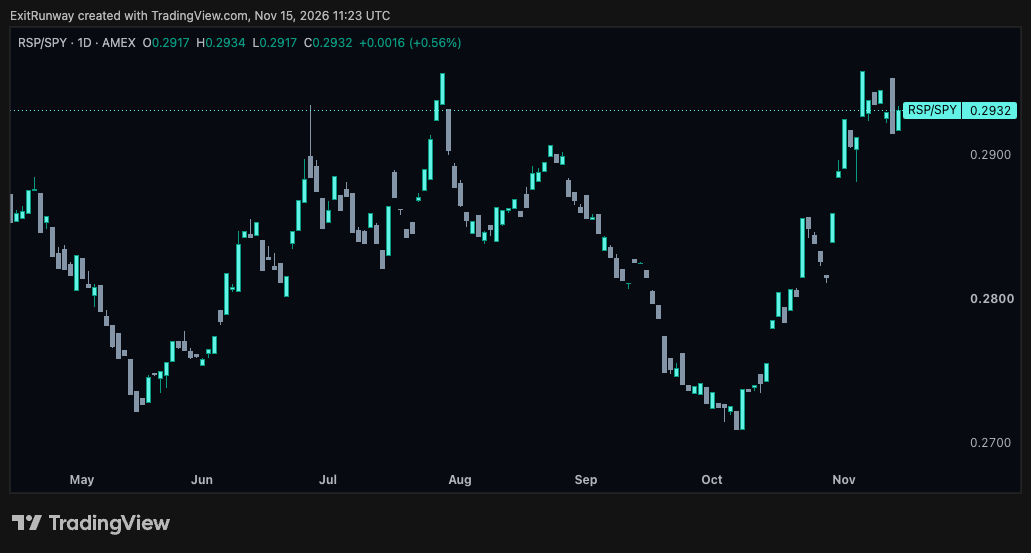
And the rest of the market turned up. All 11 sectors finished higher, and the equal-weight version of the index (RSP), which gives every company the same slice whatever its size, rose 2.37%, almost exactly what the normal fund did. That's the tell. When the two versions move together it means the gains were spread across hundreds of companies and not manufactured by two or three heavyweights. So this was a broad week with one very large casualty in the middle of it, and the fund absorbed the casualty. Call it diversification inside a single ticker, doing what it says on the tin.
Before anyone gets too comfortable, widen the lens to the month so far. Since the end of October Nvidia is down 20.42%, the S&P 500 fund is down 0.18% and the equal-weight fund is up 1.31%. In other words the average stock is ahead of the index in November, and it's ahead for exactly the same reason the index survived this week, which is the weighting. Size cuts both ways. You don't get to keep the giant that holds the fund up and hand back the one that drags it down, they come in the same box.
Two quick ones for the rest of your finances while we are here. A fund of long-dated US government bonds (TLT) lost 3.10% in the same week, because when yields jump the way they did in THE MACRO the price of the bonds already out there falls, so "safe" had the worse week of the two. And the average 30yr mortgage rate in Freddie Mac's survey slipped to 7.11%, its fourth weekly fall in a row, which looks as if it missed the bond market's memo completely. It didn't, the survey is taken Monday to Wednesday and caught only part of the move. Whether next week's reading turns back up is the open question.
What should you take from all this? Not that the big holdings don't matter, they matter enormously, the top three alone are about a fifth of the fund. It's that a scary headline about one of them and the result in your account are two different things, and the bit in between is a sum you can do yourself: how much of the fund is it? Nvidia reports its results after the close on Tuesday. Whatever the stock does next, that's the number to look up first.
One company's crisis, not the trade'sOne company's crisis, not the trade's
On paper this should have been an ugly week for the AI trade, the chief executive of its most important company resigned and no reason was given. It wasn't ugly, and why it wasn't is the most useful thing to understand about the week. The market didn't sell the theme, it went through the names one at a time.
The spenders
The companies that spend the money on AI had a quiet week, so the story belongs to one of the companies they spend it with. On Tuesday Anthropic, the company behind the Claude models, updated its filing to list its shares on the Nasdaq. For once the AI money loop that everybody argues about was sitting in a legal document where you could read it.
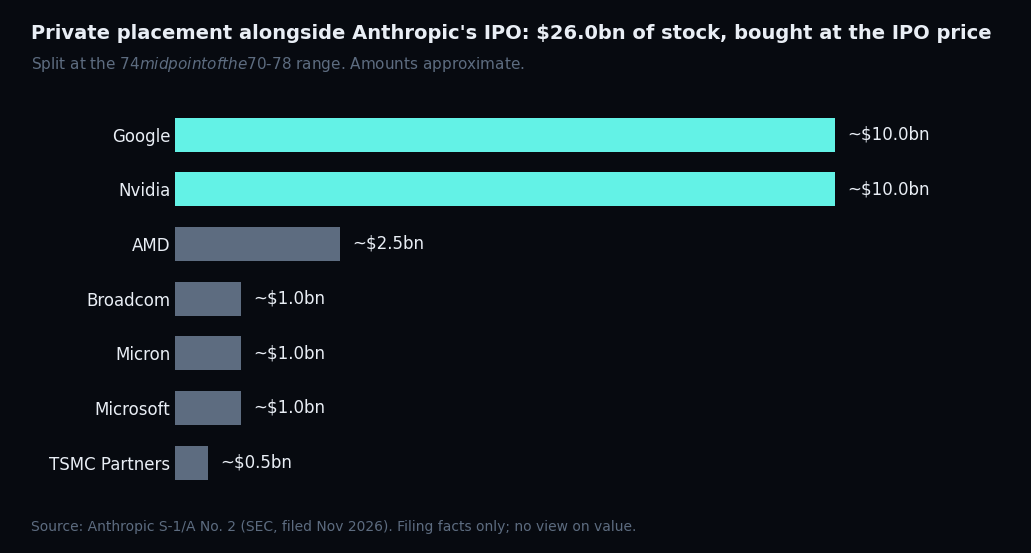
The facts first, all from the filing. Anthropic and some of its existing shareholders plan to sell 825 million shares to the public at $70 to $78 each, which comes to roughly $58bn to $64bn. Alongside that sits a private sale of another $26bn of stock at the same price, and it's the buyers that make this interesting. Google (GOOG) and Nvidia (NVDA) are down for about $10bn each at the middle of the range, and the rest is split between AMD (AMD), Broadcom (AVGO), Micron (MU), Microsoft (MSFT) and TSMC (TSM). Read that list again. It includes the companies that sell Anthropic its chips and its computing power.
Now put that next to the income statement. Revenue in the third quarter was $17.0bn, yet the quarter ended with an operating loss of $567m after a profit the quarter before, and the filing puts that mainly down to $5.0bn of computing power bought on short-term commitments, plus $2.0bn of non-cash charges. So money goes out to the suppliers as compute bills and comes back in from some of the same suppliers as share purchases. That's what the market means when it says "circular funding", and here it is with names and amounts attached. Whether a loop like that is clever or fragile is the argument of the whole AI trade, and one filing won't settle it. This note takes no view on what Anthropic is worth. The filing's own range works out anywhere from about $0.92tn to about $1.41tn depending on which share count you use, so be wary of anybody quoting you a single number.
As for the spenders themselves, there isn't much to report. Meta (META) led with a gain of 5.17%, Amazon (AMZN) and Google were up around 3%, and Microsoft was the only one lower, down 1.27%.
What to watch is the difference between the two pots of money. The $26bn comes from companies already in the trade. The public offering is money from outside it, and Anthropic expects to price on Wednesday the 18th and start trading on Thursday the 19th, subject to regulatory clearance, so that's an expectation and not a date in the diary. How the seven buyers' own shares trade that week will say a lot about whether the market reads those cheques as a smart investment or as one more line on the bill for the AI build-out.
SEMIS
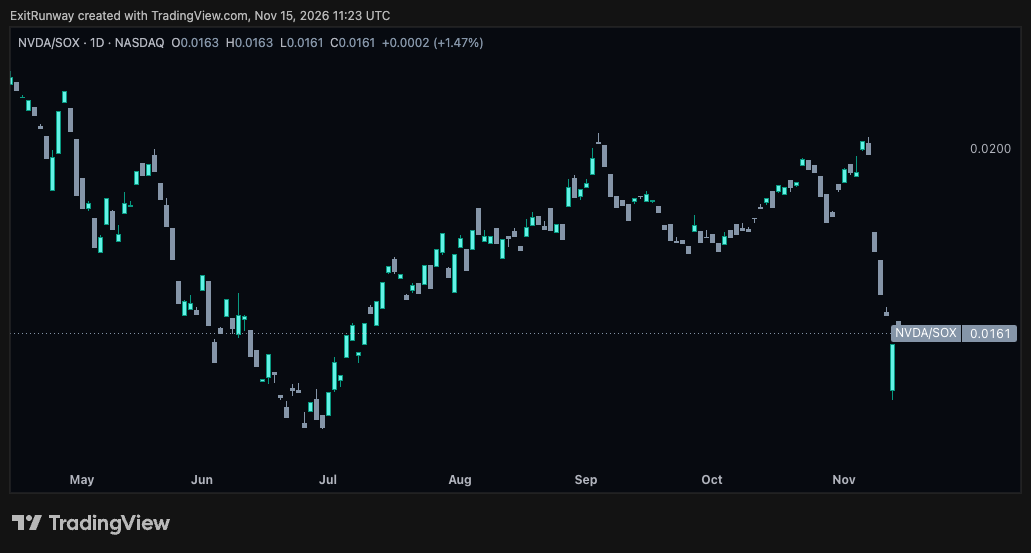
Here is a pair of numbers that takes a moment to sink in. The chip index (SOX) rose 8.05% on the week and Nvidia, the company that has been the face of the chip trade, fell 12.75%. On Thursday morning Nvidia told the market in a filing that the board had accepted co-founder Jensen Huang's resignation as president, chief executive and director, effective immediately, with finance chief Colette Kress stepping in as interim CEO. The filing gives no reason and this note isn't going to guess at one. In our data, which starts in January 2025, it was the stock's worst week since April of that year.
So where did the money go? Nowhere far, it moved next door. AMD rose 18.93% and Broadcom 18.16%, and those are the two names the market reaches for when it wants AI chips without Nvidia. That tells you what investors think they are looking at. If they believed demand for AI chips was the problem they would have sold the lot! Instead they sold one company's uncertainty and paid up for the alternatives, which is how a market behaves when it thinks the pie is fine and the fight is over who gets which slice.
Now for the cold water, because it's worth looking at what was paid for those slices. On analysts' forecasts as of 15th November Nvidia trades on about 10 times next year's expected earnings and AMD on about 30. The market is paying roughly three times as much for a dollar of the challenger's profit as for a dollar of the champion's. Does that make sense? Only if AMD takes real business off Nvidia and not just a week of headlines, and a share price moving is not the same thing as an order moving. It's also worth remembering that even after an 8% week the chip index sits 30.7% below its June high, and it gave back 3.43% on Friday. This is a bounce inside a damaged chart, not an all clear.
The next cue is Tuesday. Nvidia reports its quarter at about 4:20 pm New York time with the call at 5:00, as previously scheduled, and they are the first results since Huang left. If the business looks the way it did before, the question flips to whether the rivals get to keep what they were handed this week.
Data centres and neoclouds
A neocloud is a company that borrows money, fills data centres with AI chips and rents out the computing power. This is the corner of the AI trade that runs on borrowed money, and this week the market stopped treating it as one lump and read each set of results line by line.
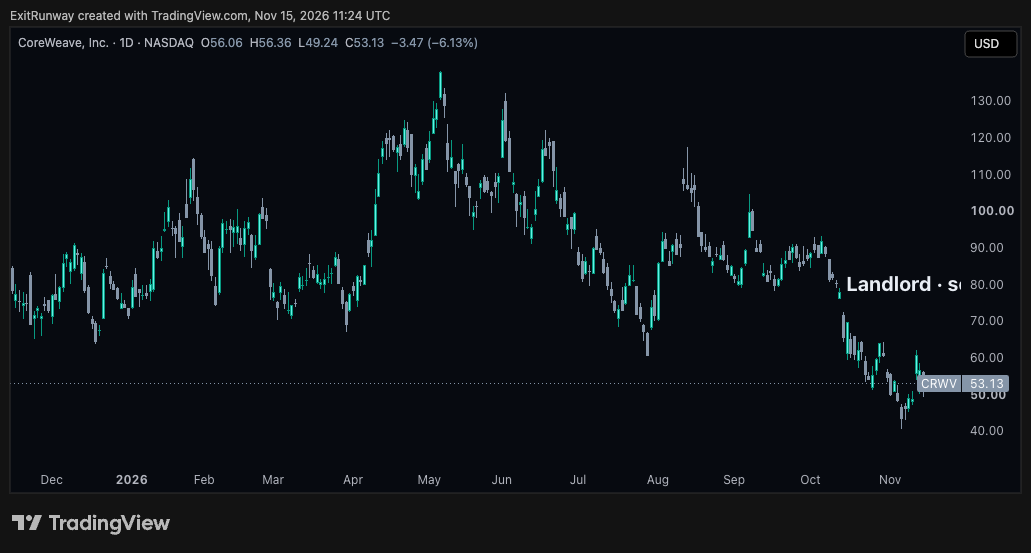
CoreWeave (CRWV) reported on Tuesday and jumped 24.71% on Wednesday. Have a look at the line a lender would go to first though. Operating income, which is the profit left after running the business but before paying the lenders, was $207m for the quarter. The net interest bill was $846m, about four times as much. Picture a landlord who clears $2,000 a month on a building after costs and owes the bank $8,000 a month on the loan. So why on earth did the stock rally? Because of where the cash is coming from. CoreWeave says it has roughly $132.5bn of signed business still to deliver and expects about $9bn of customer prepayments and deposits over the next three months. The market decided the customers will carry the interest for now.
Nebius (NBIS) got the opposite treatment and fell 16.84% on Thursday after its numbers. In the quarter it spent 7.4 times its revenue on building, so for every dollar that came in the door more than seven went out on buildings and equipment, and it now expects this year's revenue to come in at the low end of its own range. Then there is IREN (IREN), which reported nothing this week and fell 16.04% on the week anyway. Guilt by association is alive and well in this group!
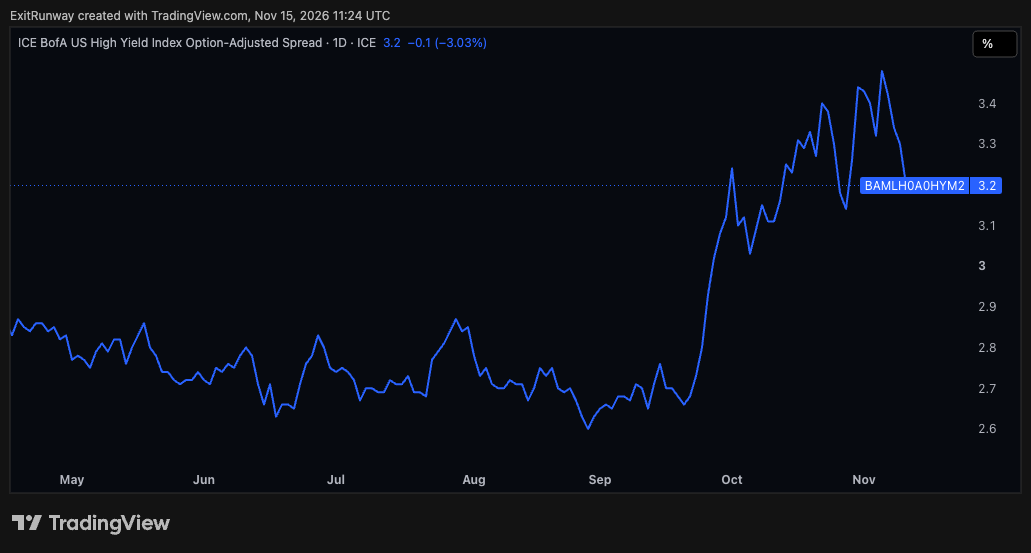
The sorting is healthy, it means the market is doing the reading. But don't mistake a relief rally for a repaired balance sheet. CoreWeave is still 61.5% below its high, the debt hasn't gone anywhere, and as THE MACRO showed the price of money went UP this week. The one piece of help came from the junk bond market, where the extra interest investors demand for lending to the weakest companies eased back from its high of the year. Lenders are still open for business. What these companies need now is for that to stay true with the 10yr above 5%, and for the $9bn to actually arrive. Those are the two things to watch.
Why cheap can be a warningA cheap cyclical is the warning, not the bargain
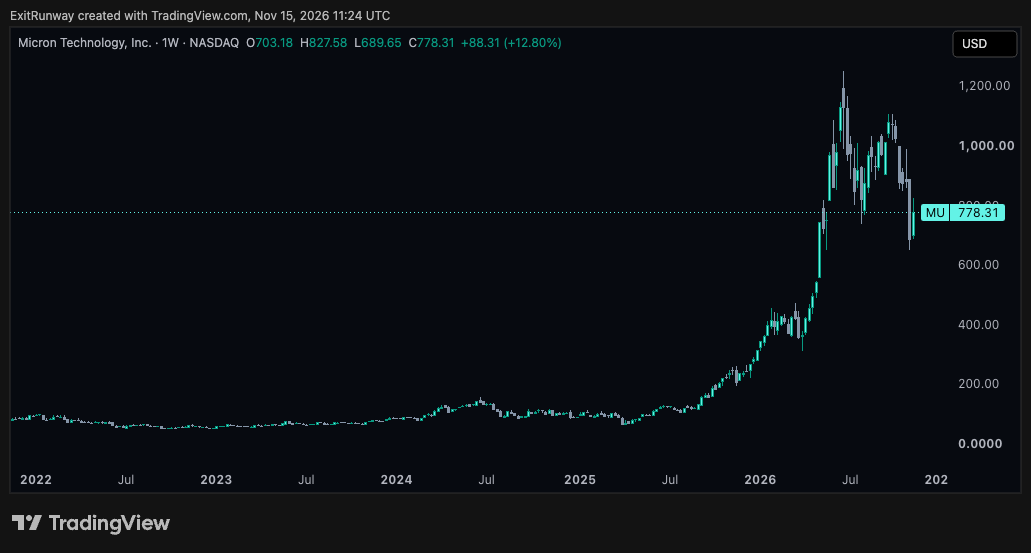
Micron (MU) closed on Friday at $778.31, and on analysts' forecasts as of 15th November that's about 3.7 times what the company is expected to earn in its financial year to August 2028. A P/E, which is the share price divided by the earnings per share, is simply how many years of profit you are paying for the stock. That is fewer than four years of profit for one of the big memory chip makers in the middle of an AI boom, so surely it's a bargain?
It might be, but that isn't what the number is telling you, and to see why you need to know what kind of business this is. Memory chips are close to a commodity, one maker's are much like another's, so the price is set by how much supply is around and the makers' profits swing far harder than their sales do. A business like that is called a cyclical. At the moment the swing is all the way up, with Micron keeping about 81 cents of every dollar of sales after the cost of making the chips over its last financial year. Now go back to its 2023 financial year. Revenue halved, from $30.76bn to $15.54bn, that same margin was MINUS 9.1%, meaning the chips cost more to make than they sold for, and the company lost $5.83bn. Same company, three years apart.
Think about what that does to a P/E. At the top of the cycle earnings are enormous, so the price divided by earnings looks tiny. At the bottom earnings vanish, so the same sum gives you a huge number or no number at all. Valuing a cyclical on its best year is like valuing an ice cream stand on its takings in July. Nobody selling you that stand at four times July is being generous and nobody refusing to pay more is being stupid, they are both pricing in the winter. That's what a very low P/E on very high margins is. The market isn't missing the earnings, it's doubting how long they last. So a cyclical tends to look cheapest near the peak and most expensive when profits have collapsed, which is exactly backwards from how a bargain hunter wants it to work.
Notice what happens when you change the year as well. On the last twelve months of actual profit Micron is on about 10.5 times, not 3.7. The gap between the two is nothing more than how much further analysts expect earnings to climb, so the cheaper the stock looks, the harder it's leaning on a forecast.
Be clear about what this does NOT tell you. It doesn't say the memory cycle has turned and it's no timing signal, the stock rose 12.80% this week. This cycle may well turn out bigger and longer than any before it, and a low P/E can be a genuine bargain when the earnings prove durable. The lesson is the question, not the answer. Before calling any cyclical cheap, ask where its margins sit against their own history, and then watch the two things that end a cycle like this, supply catching up and prices rolling over. If the margins are at the top of their range and the P/E is in single digits, that's the warning, not the bargain.
The free community
Leave your email and your Discord invite is in the confirmation email we send you straight away. The Weekly follows every Sunday.
Send my invite »